CANADIAN SOLAR INC.
The Vertically Integrated Gamble: Manufacturing, Balance Sheet Stress, and Whether Canadian Solar's Three-Business Structure Can Deliver Shareholder Value Before the Capital Markets Lose Patience


1. Corporate Profile & The Three-Business Problem
Canadian Solar generates roughly $5.5 billion in annual revenue but trades at a fraction of book value. The reason is structural: what trades under a single ticker is three materially different businesses operating under one holding company, each with a different risk profile, capital structure, margin trajectory, and valuation logic. The market’s difficulty in pricing this complexity is the origin of both the discount and the opportunity.
One ticker, three businesses
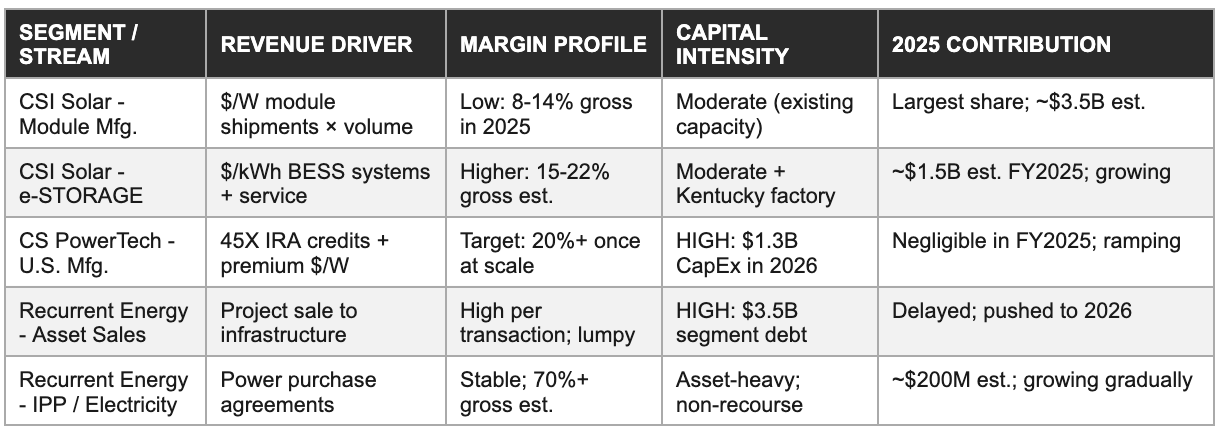
Canadian Solar Inc. was incorporated in Ontario and is listed on NASDAQ under the ticker CSIQ. It operates through two formally reported segments, CSI Solar and Recurrent Energy, but the operational reality is more granular. CSI Solar encompasses both the legacy Chinese-domiciled manufacturing operations and the newly formed CS PowerTech, a 75.1%-controlled U.S.-incorporated joint venture established in late 2025 to hold domestic solar cell, module, and battery storage manufacturing assets. Recurrent Energy is the global project development and independent power producer subsidiary. The three entities (legacy CSI Solar manufacturing, CS PowerTech, and Recurrent Energy) each require a separate investment thesis, a separate debt analysis, and a separate set of value-creation milestones.
The company was founded by Dr. Shawn Qu in 2001. Over its 25-year operating history, Canadian Solar has shipped more than 100 gigawatts of solar modules to customers across more than 100 countries and regions, developed and connected approximately 12 gigawatts of utility-scale solar power projects globally, and built one of the five largest battery energy storage backlogs in the world through its e-STORAGE business unit.
The valuation compression and what it is pricing
The scale of those achievements sits uneasily alongside a market capitalisation that has oscillated in the $400 million to $950 million range over the trailing 52 weeks, a compression that implies the market is pricing a sustained deterioration rather than a cyclical trough. The question is whether that pricing reflects a permanent structural impairment of the business model or a temporary convergence of three simultaneous headwinds, module margin collapse, Recurrent Energy project delays, and elevated debt service, that are each mean-reverting on different timelines.
The three-business structure creates complexity that most single-segment solar peers do not face. CSI Solar’s legacy Chinese manufacturing carries the tariff exposure, FEOC disqualification risk, and commodity margin pressure that the market prices harshly. CS PowerTech carries the capital expenditure burden of building U.S. domestic manufacturing from scratch, a $1.3 billion commitment in 2026 alone, against a market capitalisation in the same range. Recurrent Energy carries approximately $3.5 billion in project-level debt and generates revenue in lumps, when projects reach commercial operation or are sold to infrastructure investors, rather than in the quarterly linearity that equity markets prefer.
The investment thesis is that these three headwinds are being priced as permanent when they are at least partially cyclical, and that the sum of the three businesses, a globally diversified solar manufacturer with a first-mover U.S. HJT cell factory, a $3.5 billion storage backlog business, and a 24-gigawatt project development platform, is worth more than the current market valuation implies. The bear case is that the debt load constraining all three segments produces a capital structure that impairs the equity before the recovery thesis can be realised.
2. Founding Arc & The May 2026 Leadership Transition
Dr. Shawn Qu built Canadian Solar from a two-person Ontario startup to a $5.5 billion revenue global company over 25 year one of the longest founder-led runs in the solar industry. His transition to Executive Chairman and CTO in May 2026 is a live variable that the market has not fully processed.
The original dual-sided bet
Qu founded the company in 2001 with a specific conviction: that solar photovoltaics would achieve cost parity with fossil-fuel electricity within his working lifetime, and that the companies positioned to serve both the manufacturing and the project development sides of that transition would capture disproportionate economic value. That dual-sided bet, make the modules and own the plants, is still the structural logic of the business in 2026, though the capital requirements of maintaining both positions simultaneously have become increasingly difficult to justify to the equity market.
The company’s trajectory from 2001 to the present divides into three identifiable phases.
The first phase, from founding through the its listing in 2006, established the manufacturing base and the early customer relationships that enabled rapid scale. The second phase, from 2010 through 2019, saw the company enter project development through Recurrent Energy, expand e-STORAGE, and reach annual module shipments of approximately 10 gigawatts. The third phase, from 2020 through the present, is defined by the twin pressures of module commoditisation and the capital intensity of the U.S. manufacturing build-out. a phase the company entered in 2025 with significantly more debt than it carried in 2019.
Colin Parkin and what the transition means for capital allocation
The May 2026 CEO transition is important for two reasons.
First, Colin Parkin brings a specific and relevant operational history: he spent 20 years at Canadian Solar, served as president of e-STORAGE before it became the company’s highest-growth segment, and served as a board member and then President of the consolidated entity before his elevation to CEO. His institutional knowledge of the storage business is the segment-specific competence most relevant to the forward strategy.
Second, Qu’s retention as Executive Chairman and CTO preserves his strategic oversight role while giving Parkin operational authority, a structure that works when founder and successor are aligned on direction and becomes complicated when they diverge on capital allocation priorities.
The transition arrives at a moment of maximum operational complexity. Canadian Solar is simultaneously ramping two U.S. manufacturing facilities, executing a multi-year Recurrent Energy asset monetisation cycle, managing $6.4 billion in consolidated debt, and navigating a trade policy environment that has changed more in 18 months than in the prior decade. A new CEO inheriting this context without a public track record of leading a company through comparably complex capital allocation decisions is an execution risk that investors should price explicitly.
The IP landscape: Trina Solar patent challenge dismissed
The intellectual property front is also active. In April 2026, the U.S. Patent Trial and Appeal Board issued final written decisions invalidating all claims of two TOPCon solar cell patents that Trina Solar had asserted against Canadian Solar subsidiaries. This outcome removes a potential manufacturing cost liability and confirms that Canadian Solar’s HJT cell technology pathway does not carry the TOPCon IP exposure that some analysts had flagged as a risk to the Jeffersonville ramp.
3. Revenue Architecture: How the Three Segments Interact
Canadian Solar’s revenue has exceeded $5 billion annually since 2021, yet the business has generated inconsistent profits because its three revenue streams carry fundamentally different economics, different timing, and different capital requirements that rarely align in the same quarter. The interaction between the three, manufacturing funding development, development generating lumpy project sale revenue, storage providing the most durable gross margin, is the flywheel the long-term thesis depends on.
CSI Solar: Modules and the U.S. manufacturing split
CSI Solar, the manufacturing and products segment, generates revenue through solar module shipments priced in dollars per watt and through battery energy storage system deliveries priced in dollars per kilowatt-hour. Module revenue is volume-driven and margin-compressed: global module prices fell to historic lows through 2024 and 2025, driven by overcapacity in Chinese manufacturing that has structurally reset industry-level gross margins. Battery storage revenue, generated through the e-STORAGE brand, operates on a different economic logic, projects are contracted months or years in advance at defined prices, backlog provides revenue visibility, and the per-unit margin on BESS systems has historically been higher than on modules.
The distinction within CSI Solar between the legacy manufacturing base and the emerging CS PowerTech U.S. operations is commercially important. Legacy manufacturing serves global markets and is subject to commodity pricing dynamics with no premium for domestic origin. CS PowerTech, once its Indiana HJT cell factory reaches commercial scale, will supply U.S. customers with modules that qualify for the 45X Advanced Manufacturing Production Credit and whose supply chain provenance satisfies the FEOC restrictions on IRA tax credit eligibility. That structural difference in the value proposition, and in the margin profile, makes CS PowerTech a separate investment thesis within the manufacturing segment.
Recurrent Energy: The two revenue pathways
Recurrent Energy generates revenue through two fundamentally different mechanisms. The first is project asset sales: Recurrent Energy develops solar and battery storage projects through the permitting, interconnection, and construction cycle, then sells completed or operating assets to infrastructure funds, pension funds, and utilities at a gain over accumulated development cost.
This mechanism generates high-value but lumpy revenue that is inherently difficult to predict or schedule with quarterly precision. The second mechanism is electricity revenue from projects that Recurrent Energy retains in an IPP structure, generating power purchase agreement revenue over multi-decade contract periods. The IPP portion provides durability and predictability; the asset sale portion provides the capital recycling that funds further pipeline development.
The interaction between the two segments is what makes Canadian Solar structurally different from a pure manufacturer or a pure developer. Recurrent Energy consumes approximately one gigawatt of CSI Solar modules per year for its own projects, providing an internal demand floor that partially shields the manufacturing segment from spot-market price pressure. CSI Solar’s BESS products supply Recurrent Energy’s storage projects at transfer prices that contribute margin to the manufacturing segment while reducing Recurrent Energy’s supply chain risk. This internal supply relationship is commercially rational but also creates accounting complexity: intercompany eliminations, transfer pricing assessments, and minority interest allocations all affect the reported consolidated financials in ways that make simple revenue multiple analysis misleading.
The quarterly dynamics that drive confusion
The quarter-to-quarter revenue pattern is dominated by two dynamics that investors in linear-revenue businesses consistently underestimate.
The first is the Recurrent Energy project sale timing: a single large project sale can add $50 million to $150 million in quarterly revenue with minimal incremental cost, making gross margin jump dramatically in the quarter of recognition and then revert when the next sale is delayed.
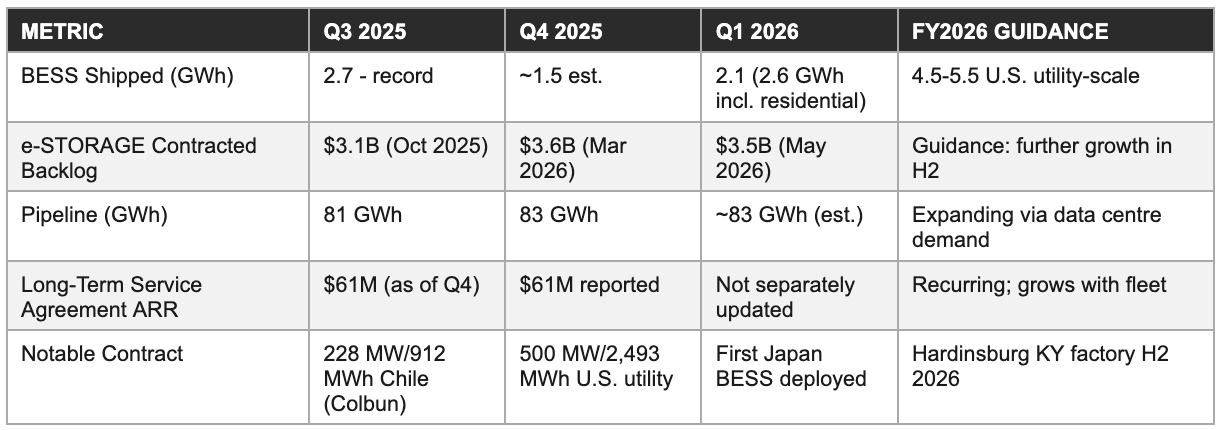
The second is the storage shipment ramp: e-STORAGE delivered a record 2.7 gigawatt-hours in Q3 2025, then saw volumes normalise in Q4 2025 and Q1 2026 as certain large orders shipped early. The combination of delayed project sales in Q4 2025 and normalising storage volumes produced the 10.2% gross margin that triggered the March 2026 earnings decline.
Management has explicitly framed the FY2026 revenue pattern as back-half weighted, with Q2 2026 guided at $1.0 billion to $1.2 billion revenue and 13% to 15% gross margin, a range that reflects normalised storage volumes without the one-time Q1 tariff refund, and that implicitly forecasts a significant H2 2026 recovery as U.S. manufacturing ramps and Recurrent Energy completes delayed project sales.
That framing is internally consistent. Whether it is achievable depends on the three specific execution risks addressed in subsequent sections.
4. The U.S. Manufacturing Sovereignty Bet: CS PowerTech, HJT, and the CapEx Cycle
Canadian Solar is spending more in 2026 on U.S. manufacturing capital expenditure than its current market capitalisation. That ratio is the central financial tension in the investment case. The bet is that the 45X Advanced Manufacturing Production Credit, the FEOC-driven demand for non-Chinese supply chains, and the premium efficiency of HJT technology will produce margins sufficient to justify that capital deployment.
Three factories, one strategic thesis
The U.S. manufacturing strategy rests on three physical assets. The Mesquite, Texas module assembly facility reached full production capacity at 5 gigawatts in mid-2025. Management has committed to doubling nameplate capacity to 10 gigawatts in the second half of 2026 through additional production line installation. The Jeffersonville, Indiana HJT solar cell factory produced its first trial cells in March 2026, with commercial operation targeted for July 2026.
Phase I capacity is 2.1 gigawatts peak; the company has already committed to Phase II expansion that will bring total U.S. cell capacity to 6.3 gigawatts, establishing what management describes as the largest crystalline silicon solar cell manufacturing footprint in the United States. The Hardinsburg, Kentucky facility, which will produce lithium battery cells, battery packs, and complete BESS systems, has commenced production of certain components and targets full BESS production capability by Q4 2026.
Why HJT over TOPCon
The HJT technology choice is commercially significant and reflects a deliberate differentiation from the TOPCon technology that most Chinese manufacturers have standardised on. Heterojunction technology produces cells with higher conversion efficiency, the Jeffersonville facility is targeting modules up to 24.4% efficiency, lower temperature coefficient, and better bifacial performance than equivalent TOPCon products.
In a market where module prices have been driven to near-commodity levels, efficiency premium is the primary mechanism through which a manufacturer can command above-average selling prices. HJT modules carry a premium of approximately $0.02 to $0.05 per watt over TOPCon equivalents in U.S. commercial and utility markets, a margin contribution that compounds meaningfully at 6.3 gigawatts of annual domestic cell output.
The April 2026 PTAB ruling invalidating Trina Solar’s TOPCon patents against Canadian Solar subsidiaries removes a legal uncertainty that had introduced execution risk around the cell factory ramp. Canadian Solar’s HJT pathway was never directly covered by those patents, but the litigation had created a cloud over the broader IP landscape for advanced solar cell technologies in U.S. manufacturing contexts.
The 45X credit as the economic engine
The 45X Advanced Manufacturing Production Credit, structured as a dollar-per-watt tax credit for domestically manufactured solar components, is the economic engine that makes the U.S. capital investment viable. At current credit levels, a fully domestically manufactured module, using U.S.-fabricated cells, U.S.-assembled modules, and U.S.-produced BESS components, can qualify for credits that effectively cover a substantial portion of the manufacturing cost premium over imported alternatives.
Management’s Q1 2026 earnings commentary indicated that the combination of 45X credits and the efficiency premium from HJT technology creates a path to gross margins on U.S. manufacturing operations that exceed the blended corporate average, though specific margin guidance for CS PowerTech has not been provided separately.
The transitional supply chain risk
The transitional period between today and full domestic supply chain integration carries a specific risk: Canadian Solar is currently sourcing solar cells for the Mesquite module factory from third-country suppliers while the Jeffersonville cell factory ramps. The exact country origin of those transitional cell supplies determines whether modules assembled at Mesquite qualify for the full 45X module assembly credit during the transition period and whether they satisfy the FEOC supply chain requirements discussed in the following section. Management acknowledged this transitional dependency on the Q1 2026 earnings call but declined to specify the source countries.
The capital commitment is the most important number in the investment thesis. Against a market capitalisation that has spent most of 2026 in the $400 million to $700 million range, a 2026 capital expenditure programme of approximately $1.3 billion implies that the company is investing more than its current equity market value in a single year’s worth of factory construction. This ratio is consistent with the historical capital intensity of greenfield semiconductor or advanced materials manufacturing, it is the ratio that has contributed meaningfully to the equity discount relative to book value. The return on that capital depends entirely on the margin assumptions in Section 11.
5. The Trade Policy Labyrinth: Tariffs, FEOC, IRA 45X, and the Margin Question
For most companies, trade policy is a background risk disclosed in filing boilerplate. For Canadian Solar, it is the primary pricing mechanism for its largest revenue market, the structural determinant of whether U.S. manufacturing investment produces the margins management projects, and the legislative risk that could invalidate the entire capital deployment rationale at any point in the next two years.
The Q1 2026 tariff refund: Why the headline margin misleads
The Q1 2026 gross margin of 25.1% was the highest quarterly figure Canadian Solar has reported in several years. The quality of that margin deserves scrutiny: management disclosed that a $93 million IEEPA tariff refund was recognised in cost of goods sold during Q1 2026.
Without that one-time item, gross margin in Q1 2026 would have been approximately 16% to 17%, still an improvement over Q4 2025’s 10.2%, but a different picture from the headline figure. Management’s Q2 2026 gross margin guidance of 13% to 15% reflects the normalised business without the tariff refund benefit, and is the more relevant baseline for modelling the underlying margin trajectory.
The IEEPA tariff framework has created a complex and shifting cost structure for solar module imports. Canadian Solar, like all solar manufacturers shipping product to the U.S. from Southeast Asian facilities, has been subject to elevated import duty rates that compress module margins on non-domestically produced inventory. The Q1 2026 refund reflects a partial reversal of certain tariff assessments, but the framework itself remains in active policy flux.
The administration has signalled both escalation and selective relief at various points in 2025 and 2026, making any forward gross margin model for the manufacturing segment dependent on tariff scenario assumptions that carry genuine uncertainty.
FEOC: The qualification test that changes the storage market
The FEOC designation framework in the Inflation Reduction Act creates a separate and potentially more durable risk. IRA provisions governing the Clean Vehicle Credit and the Clean Electricity Investment Tax Credit include requirements that qualifying projects not source battery components or critical minerals from FEOC-designated entities, which currently includes Chinese manufacturers.
The e-STORAGE business supplies battery energy storage systems whose battery cell content, if sourced from Chinese manufacturers, could expose Recurrent Energy project buyers to IRA tax credit disqualification, a commercial consequence that would immediately impair the value proposition of Recurrent Energy’s BESS-integrated project pipeline.
The Kentucky BESS factory addresses this risk directly. By manufacturing lithium battery cells and packs in the U.S. using supply chains designed to satisfy FEOC requirements, Canadian Solar’s storage systems sold by CS PowerTech will qualify for IRA credits in a way that imported Chinese-cell systems cannot. This FEOC qualification premium is a commercial prerequisite for selling into the fastest-growing segments of the U.S. utility-scale storage market, where project financing increasingly requires IRA credit eligibility as a condition of debt service coverage assumptions.
The 45X credit: How much is it worth at full scale
The 45X Advanced Manufacturing Production Credit creates a direct per-unit economic benefit for U.S.-manufactured solar and storage components. For solar cells manufactured in the U.S., the credit is approximately $0.04 per watt of nameplate capacity. For solar modules assembled in the U.S. using domestically produced cells, an additional module assembly credit applies. For battery storage systems manufactured in the U.S., a per-kilowatt-hour credit applies to the cell and module components.
At 6.3 gigawatts of planned U.S. cell capacity and 4.5 to 5.5 gigawatt-hours of planned U.S. utility-scale storage shipments, the combined 45X credit benefit to Canadian Solar’s consolidated financials, either recognised directly or passed through to customers at reduced pricing, could reach several hundred million dollars annually at full ramp, representing a structurally competitive advantage over manufacturers without qualifying domestic capacity.
Legislative risk: A tail risk, not the base case
The legislative risk is real and requires explicit acknowledgement. The 45X credit, the FEOC framework, and the broader IRA manufacturing incentive architecture are creatures of statute and regulation that can be modified by subsequent Congressional action or executive rulemaking. The political durability of the IRA’s clean energy provisions has been actively debated since the November 2024 elections.
At the time of this report, the 45X credits remain in effect and the administration has shown limited appetite for repeal of manufacturing incentives that directly benefit U.S. factories in politically relevant congressional districts, including Jeffersonville, Indiana and Hardinsburg, Kentucky. The risk is modelled in the bear case in Section 11, but it is a tail risk rather than the base case.
6. e-STORAGE: The growth engine with a $3.5 billion backlog
The battery energy storage business is the segment of Canadian Solar that is most likely to determine whether the equity creates value over the next three years. Its $3.5 billion contracted backlog, $61 million in annual recurring service agreement revenue, and 83 gigawatt-hour development pipeline represent a fundamentally different economic profile from the commodity module business, and one that the market has consistently underweighted in its valuation of the consolidated entity.
From early entry to global scale
Canadian Solar entered the battery energy storage market through its e-STORAGE subsidiary in the early 2010s, before BESS systems achieved the cost levels that made utility-scale deployment commercially rational. Colin Parkin, now CEO of the parent company, built e-STORAGE into a globally recognised BESS supplier as its president. The current business serves utility-scale grid storage applications across North America, Europe, Latin America, Asia-Pacific, and the Middle East, with over 18 gigawatt-hours of systems shipped globally as of late 2025.
The $3.5 billion backlog: Revenue visibility the module business cannot match
The contracted backlog of $3.5 billion as of the Q1 2026 earnings release represents signed orders with contractual delivery obligations, purchases the customer has committed to and that Canadian Solar is obligated to deliver. This figure is distinct from pipeline or development pipeline, which represent earlier-stage opportunities. The backlog-to-revenue conversion timeline typically spans 12 to 36 months from contract execution to delivery, providing earnings visibility that the module manufacturing business structurally cannot offer. At 2025’s implied e-STORAGE revenue of approximately $1.5 billion, the backlog represents more than two years of forward revenue coverage at current run rates.
The $61 million annual recurring revenue from long-term service agreements on deployed BESS systems is the most durable component of the storage business. Service agreements cover maintenance, performance monitoring, warranty management, and capacity guarantee commitments on the operating asset fleet. This revenue is contractually committed, renews automatically in many cases, and grows mechanically as the installed fleet expands. At the current fleet size, $61 million represents a small fraction of total e-STORAGE revenue, but it is the foundation of a recurring revenue model that distinguishes the storage segment from the transactional module business.
Data centres and the structural demand driver
Demand drivers for grid-scale storage are accelerating. Data centre load growth is creating grid stability challenges that utilities are addressing with storage procurement, a dynamic that management highlighted in Q3 2025 commentary and that is visible in the 500 megawatt, 2,493 megawatt-hour contract for a U.S. utility supporting data centre grid infrastructure announced in early 2026. The energy transition requirements of decommissioning thermal baseload and integrating variable renewable generation are creating structural storage demand that is largely independent of module pricing cycles.
Kentucky: The FEOC-compliant supply chain that changes the value proposition
The Kentucky BESS factory adds a forward dimension to the e-STORAGE story that the current backlog figures do not capture. By manufacturing battery cells and complete BESS systems domestically, Canadian Solar will be able to supply IRA-qualifying, FEOC-compliant storage systems that command a structural price premium over imported alternatives in the U.S. market.
The regulatory qualification premium, the difference in price that a project developer can charge for a BESS system that enables the project’s investors to claim IRA tax credits versus one that does not, is not yet fully visible in the backlog figures because the Kentucky factory has not yet reached commercial production scale.
The competitive risk in storage is different from modules. The dominant battery cell suppliers globally are CATL and BYD, both Chinese entities that face FEOC disqualification in the U.S. IRA credit market. Western storage system integrators, Fluence, Powin, Tesla Energy, Wärtsilä, are competing for the IRA-qualifying segment, but each depends on cell supply chains that are themselves subject to FEOC scrutiny.
Canadian Solar’s vertical integration from cell manufacturing through complete BESS system delivery, once the Kentucky factory is operational, would be one of the few fully domestically sourced storage supply chains in the U.S. market. That vertical integration advantage is the commercial rationale that makes the Kentucky capital investment strategically coherent despite its scale.
7. Recurrent Energy, the Conglomerate Discount & the Sum-of-the-Parts Question
The core reason Canadian Solar trades at a discount to most conventional valuation benchmarks is that the market cannot agree on how to price a company that is simultaneously a commodity manufacturer, a high-growth storage systems integrator, and a project development platform carrying $3.5 billion in segment-level debt. The sum-of-the-parts analysis below suggests the conglomerate discount may be more than justified by the debt load, but that selective resolution of that discount through asset sales or segment-level capital recycling could meaningfully change the equity value.
Recurrent energy: The deferred value machine
Recurrent Energy develops utility-scale solar and battery storage projects across North America, Europe, Latin America, Asia-Pacific, and the Middle East. The global solar development pipeline stood at approximately 24 gigawatts and the battery storage pipeline at 83 gigawatt-hours as of December 2025. Approximately 15 gigawatts of solar projects are under operations and maintenance contracts, providing a recurring revenue base that grows mechanically as projects reach commercial operation.
The business model has two revenue pathways. In markets where Recurrent Energy retains project ownership, primarily markets with stable currencies, where long-duration power purchase agreements can be financed on the balance sheet, the company recognises electricity revenue over the life of the PPA, building a portfolio of contracted cash flow streams that resembles a regulated utility’s revenue base. In markets where the development-to-sale cycle is preferred, primarily markets with less currency stability or where capital recycling discipline requires liquidity, projects are sold to infrastructure investors at a development profit, and the proceeds fund the next cycle.
Q4 2025 was the quarter that crystallised the Recurrent Energy risk for the market. Management disclosed that certain project sales had been delayed into 2026, compressing Q4 gross margin to 10.2% on a consolidated basis. The delays were attributed to the timing of project completion milestones rather than buyer credit or pricing deterioration, a distinction that management emphasised and that, if accurate, implies the revenue is deferred rather than impaired. The FY2026 Recurrent Energy strategy explicitly calls for increased project ownership sales to recycle capital, manage debt, and improve consolidated cash flow.
The debt carried by Recurrent Energy, approximately $3.5 billion as of Q1 2025, the most recent segment-level disclosure, is primarily project-finance non-recourse debt secured against individual operating assets rather than against the consolidated parent. Non-recourse project debt is structurally subordinated to the equity value of the projects it finances; if a project generates cash flow above debt service, the excess accrues to Recurrent Energy’s equity stake.
The commercial consequence of this structure is that Recurrent Energy’s equity value is the residual claim on project cash flows after debt service, a claim that is valuable when projects are operating to plan but that provides limited buffer when project completion is delayed and debt service continues to accrue.
The conglomerate discount and sum-of-the-parts
The consolidated market capitalisation implies a severe discount to any disaggregated sum-of-the-parts assessment. The table below presents a simplified SOTP framework across the four identifiable business units, using conservative valuation multiples consistent with comparable transactions in each segment. The purpose of the exercise is not to generate a precise intrinsic value, the inputs carry genuine uncertainty. The purpose is rather to illustrate where the market’s consolidated valuation sits relative to a segment-by-segment assessment.
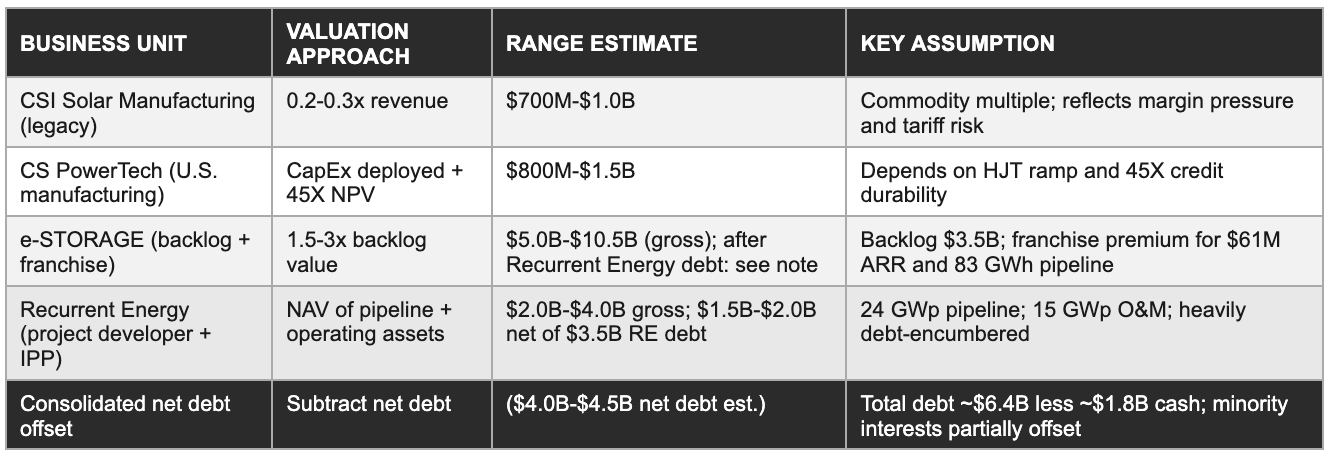
The exercise illustrates the central tension: e-STORAGE, valued on backlog and franchise alone, could represent more gross value than the entire consolidated enterprise value. However, the $4.0 to $4.5 billion in estimated net debt, distributed across CSI Solar manufacturing CapEx facilities and Recurrent Energy project finance, absorbs most of that gross value before it reaches the common equity. The equity residual is what the market is pricing in the $400 million to $950 million capitalisation range, and that residual is genuinely sensitive to the debt trajectory.
Three paths exist to closing the conglomerate discount.
The first is successful U.S. manufacturing ramp: if CS PowerTech reaches full production and its 45X-enhanced margins are visible in reported financials, the market may begin valuing U.S. operations on manufacturing multiples comparable to First Solar rather than Chinese commodity multiples.
The second is Recurrent Energy asset monetisation: if 2026 delivers the project sale cycle management has guided for, reducing segment debt and generating equity value through development profit recognition, the consolidated balance sheet improves materially.
The third is a potential future separation of e-STORAGE as an independently valued entity, a step management has not announced but that the backlog size and growth trajectory make structurally plausible over a three-to-five-year horizon.
8. Financial History & The 2025 Breakdown
Canadian Solar’s revenue peaked at $7.6 billion in FY2023 and has contracted in each subsequent year. The contraction is not a demand-side story, as global solar installations set records in 2024 and 2025. It is a price-side story: module prices fell approximately 40% from 2022 levels to multi-year lows by 2025, compressing the revenue value of every gigawatt shipped. The 2025 net loss and the Q4 2025 margin collapse reflect the simultaneous impact of pricing, delayed project sales, and the capital carrying costs of the U.S. manufacturing build-out.
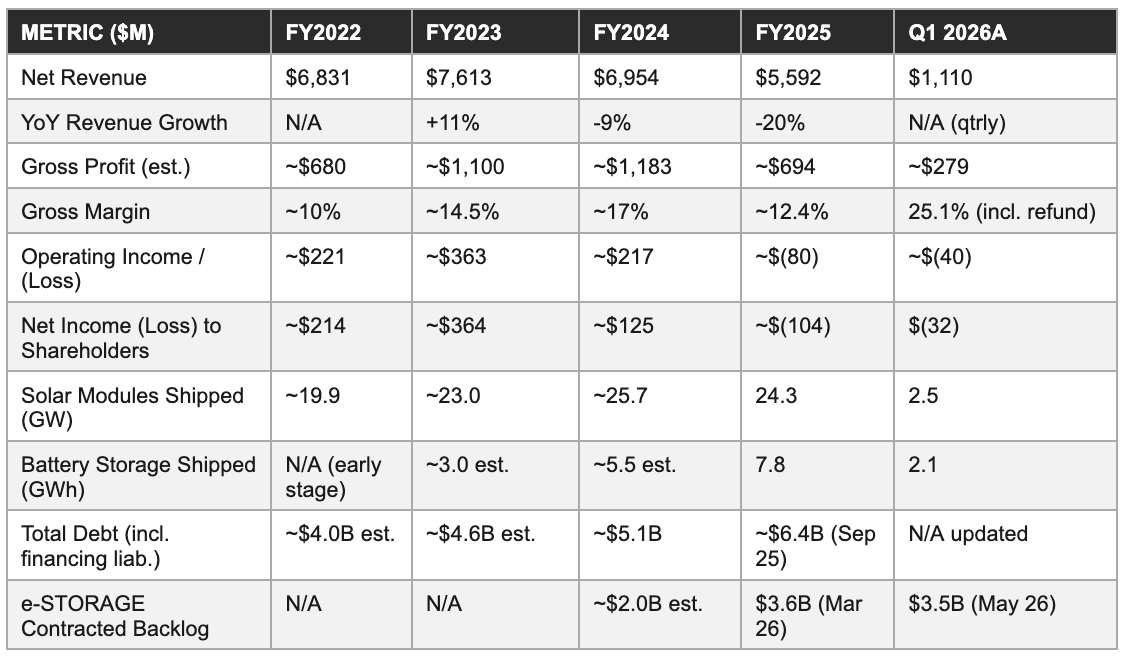
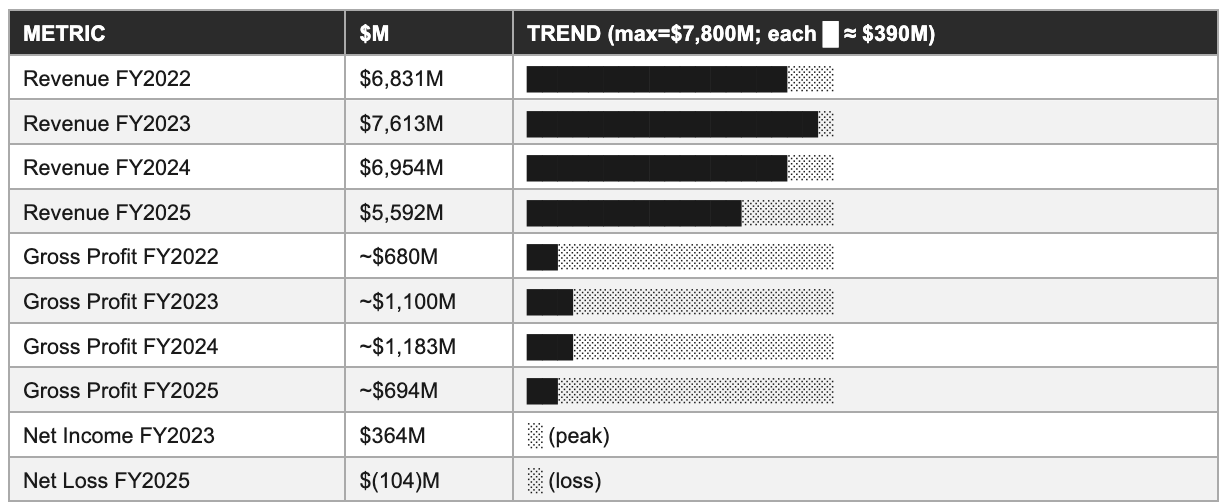
The FY2025 revenue decline from $6.95 billion to $5.59 billion reflects two distinct forces. Module revenue contracted because average selling prices fell faster than shipment volumes grew. The company shipped 24.3 gigawatts in FY2025, setting a record for U.S. market deliveries, but at per-watt economics that generated materially less revenue per gigawatt than the equivalent 2023 shipments.
Battery storage revenue grew significantly, from approximately 5.5 gigawatt-hours shipped in FY2024 to 7.8 gigawatt-hours in FY2025, partially offsetting the module revenue compression, but storage revenue at current per-kilowatt-hour pricing was insufficient to compensate for the scale of module ASP erosion.
Recurrent Energy’s contribution to the FY2025 shortfall was concentrated in Q4 2025. Management disclosed that project sales that had been expected to close in Q4 2025 were pushed into 2026, producing a Q4 gross margin of 10.2%, well below the 17% achieved in Q3 2025. The quarterly sequence through 2025, with gross margins of approximately 13%, 15%, 17%, and 10.2% across Q1 through Q4, illustrates the Recurrent Energy timing variability that makes Canadian Solar’s margin profile inherently unpredictable on a quarterly basis. An investor who modelled FY2025 gross margin at 15% based on the nine-month trajectory would have been wrong by approximately 260 basis points on the full year, entirely because of the Q4 project sale delay.
The FY2025 net loss of approximately $104 million reflects the operating loss from margin compression and delayed project sales, combined with interest expense on approximately $6.4 billion in consolidated debt. At a blended interest cost of approximately 4% to 6% on the debt portfolio, annual interest expense runs to $250 million to $380 million, a carrying cost that is difficult to cover when operating income is negative. The company’s positive cash position of approximately $1.8 billion provides buffer, but the interest carry is the primary mechanism by which the current debt level impairs equity value in a compressed-margin environment.
The Q1 2026 results represent a sequential improvement on all headline metrics: revenue of $1.1 billion, gross margin of 25.1%, and a reduced net loss of $32 million. However, as noted above, the Q1 gross margin is inflated by the $93 million IEEPA tariff refund. The normalised Q1 gross margin of approximately 16% to 17% represents a genuine recovery from Q4 2025’s 10.2%, driven by higher storage shipments (2.1 to 2.6 gigawatt-hours including residential) and improved module mix towards profitable markets. The Q2 2026 guidance of 13% to 15% gross margin frames the near-term baseline.
9. Competitive Landscape
Canadian Solar competes in three separate markets simultaneously: silicon solar module manufacturing, battery energy storage systems, and utility-scale project development. The competitive intensity, margin structure, and strategic dynamics are materially different in each arena, and a company that loses competitive position in one does not automatically impair the others, but the capital requirements of competing in three markets at once amplify balance sheet risk.
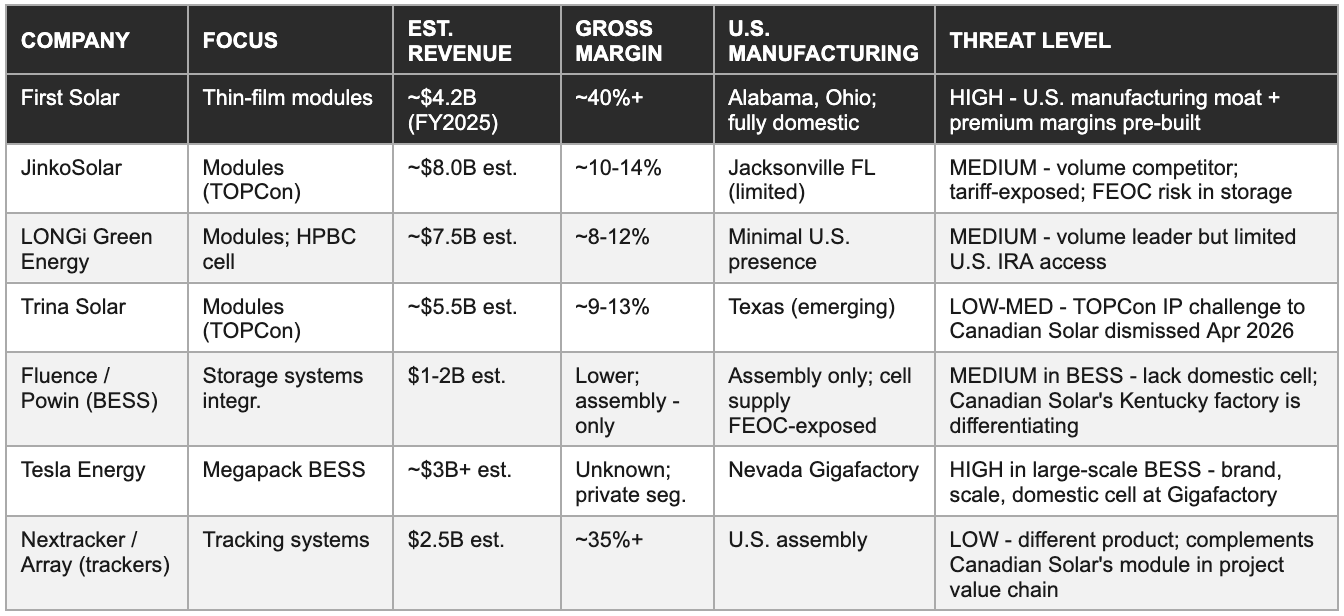
The First Solar problem
First Solar is the most strategically important competitor for Canadian Solar’s U.S. manufacturing thesis, and the comparison is not flattering for Canadian Solar in the near term. First Solar has operated U.S. solar manufacturing facilities for years, generates gross margins above 40% on its domestically produced thin-film modules, qualifies fully for 45X credits, and has no FEOC supply chain exposure. Its per-watt cost structure benefits from a manufacturing learning curve that Canadian Solar’s Indiana HJT facility will require two to three years to match. In the premium U.S. utility-scale market, First Solar is the incumbent and Canadian Solar is the challenger.
The differentiation case for Canadian Solar in the U.S. market rests on three arguments.
First, HJT technology offers higher efficiency than First Solar’s CdTe thin-film, which matters in land-constrained project sites where maximum watts per square metre is a premium feature.
Second, Canadian Solar’s silicon supply chain gives it manufacturing scalability, through established wafer and ingot sourcing relationships, that thin-film technology cannot match in volume terms.
Third, vertical integration with e-STORAGE and Recurrent Energy creates a bundled offering, modules, storage systems, and project development services from a single counterparty, that First Solar, as a module-only company, cannot provide.
The BESS competitive dynamics
In battery storage, the competitive landscape is being reshaped by the FEOC framework. CATL and BYD supply the majority of battery cells to third-party integrators globally, including to U.S. storage system assemblers. FEOC designation, if applied to these suppliers, which the regulatory trajectory suggests is increasingly likely, would disqualify systems built on their cells from U.S. IRA credit eligibility. The integrators most exposed to this disruption are those without domestic cell supply: Fluence, Powin, and others who rely on Chinese cell supply for their U.S. systems.
Tesla’s Gigafactory Nevada cell production gives it a domestic supply option that avoids FEOC disqualification. Canadian Solar’s Kentucky factory, once operational, provides the same structural protection. This convergence narrows the field of credible U.S. BESS suppliers with IRA-compliant products, which is precisely where the $3.5 billion backlog is concentrated.
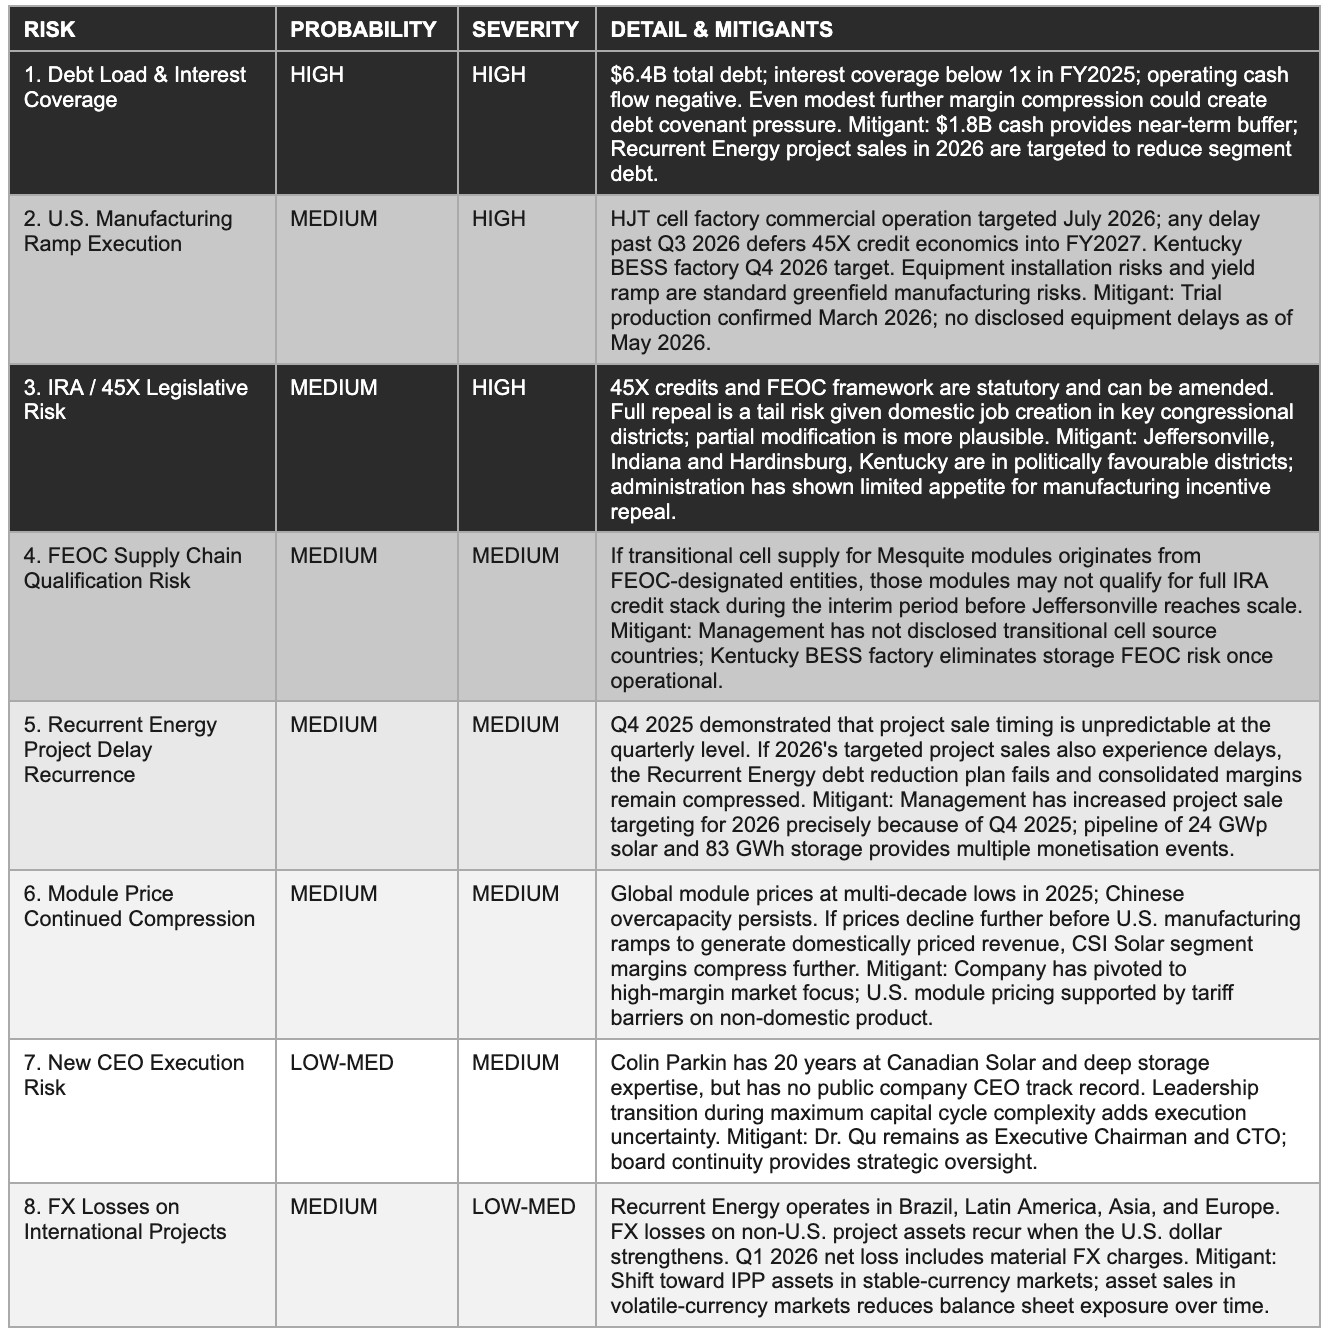
10. Risk Matrix
Each risk below is a specific variable that determines which of the three scenarios in Section 11 is realised. Probability reflects likelihood of a significant negative outcome within 24 months; severity reflects the degree of long-term equity value impairment if it materialises. Risks are ordered by combined weight.
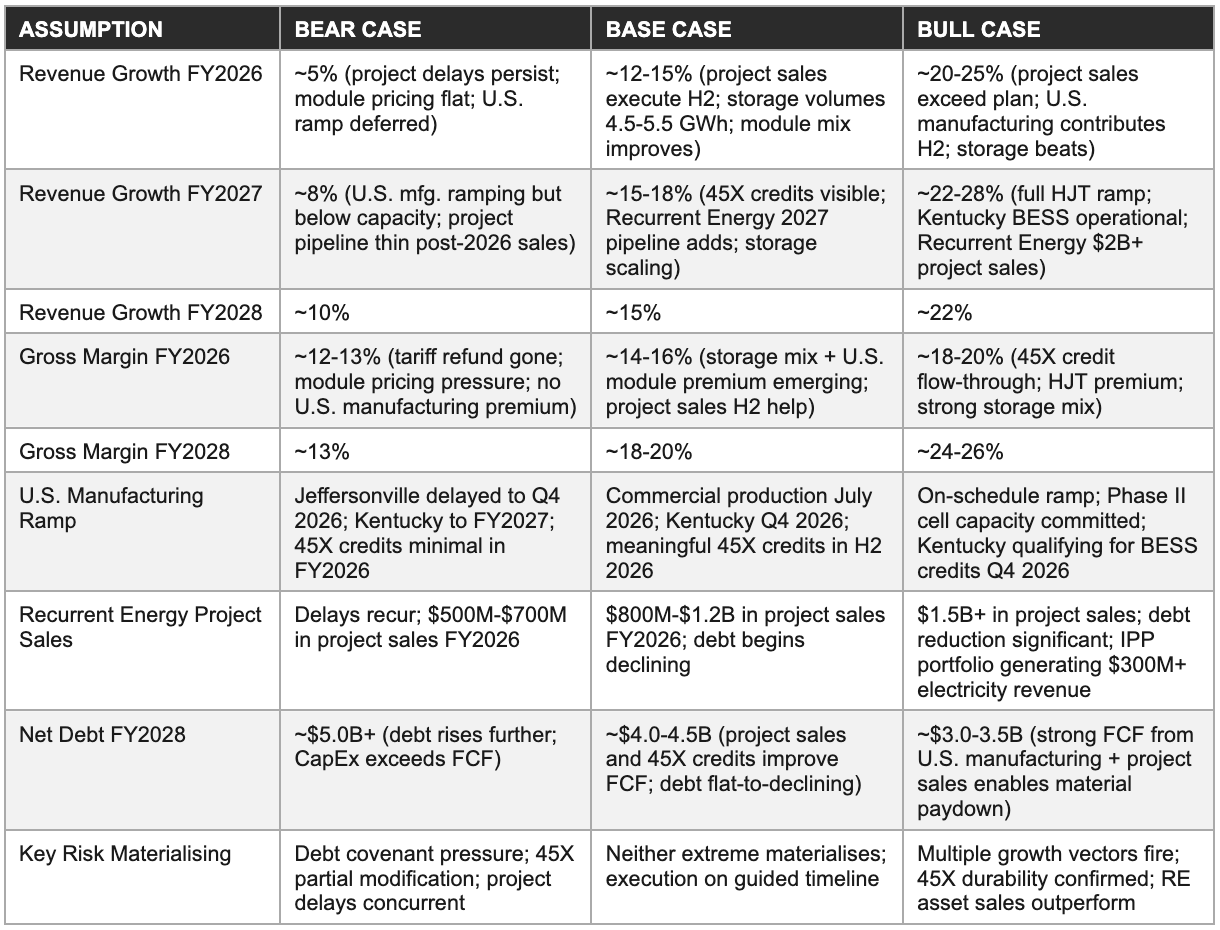
11. Forward Financial Model: Bear / Base / Bull Through FY2028
The three scenarios below are anchored to management’s Q2 2026 guidance of $1.0B-$1.2B revenue and 13-15% gross margin, with FY2026, FY2027, and FY2028 projections built on explicit scenario assumptions.
Scenario assumptions
Three-year P&L projection
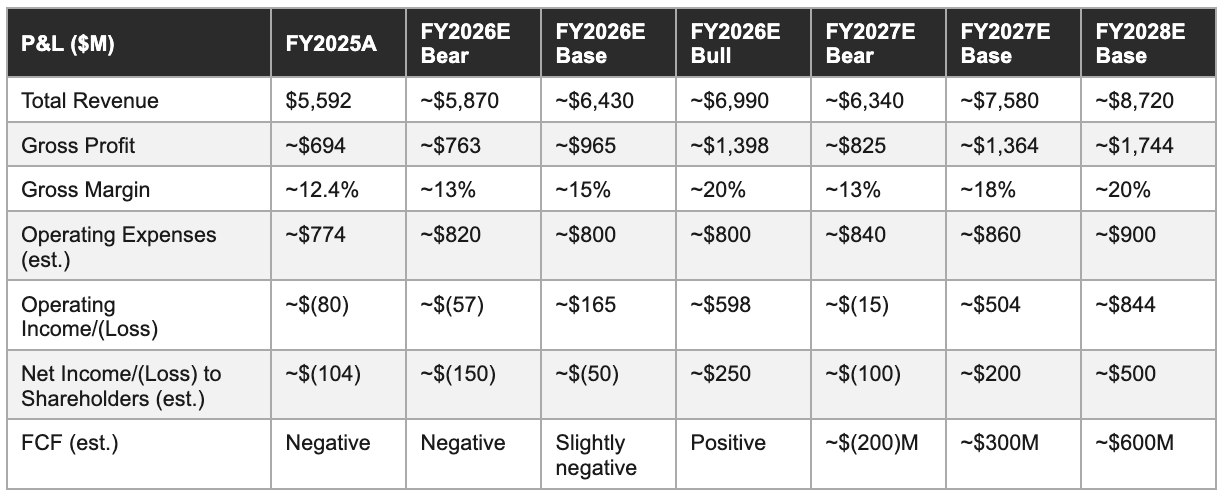
Cash runway & debt trajectory
The $1.8 billion cash position as of early 2026 provides meaningful runway against the $1.3 billion FY2026 capital expenditure commitment. Even in the bear case, where operating cash flow remains negative through FY2026 and FY2027, the existing cash balance covers the capital expenditure commitment without requiring external equity financing, assuming Recurrent Energy project sales generate at least $500 million to $700 million in net cash proceeds during FY2026.
The critical variable is not short-term solvency, the cash position and the project sale pipeline together provide sufficient liquidity. It’s the trajectory of the consolidated debt level. At $6.4 billion as of September 2025, and rising through the remaining FY2025 and Q1 2026 quarters as CapEx investment continued, the debt load will only begin declining when Recurrent Energy project sale proceeds consistently exceed the segment’s new development investment.
Management has explicitly guided for increased asset sales in 2026 to initiate that decline. Whether those sales close on schedule, as opposed to repeating the Q4 2025 delay pattern, is the single most important variable in the FY2026 financial outcome.
The base case projects net debt declining from a peak of approximately $4.8 billion in the first half of 2026 to approximately $4.0 to $4.5 billion by end of FY2028, as project sale proceeds and improving FCF from U.S. manufacturing partially offset ongoing development investment. The bull case achieves debt below $3.5 billion by FY2028, driven by stronger project sale execution and 45X credit-enhanced manufacturing cash flow. The bear case sees debt rising further, toward $5.0 billion or above, if project sales delay again and manufacturing ramp falls below plan.
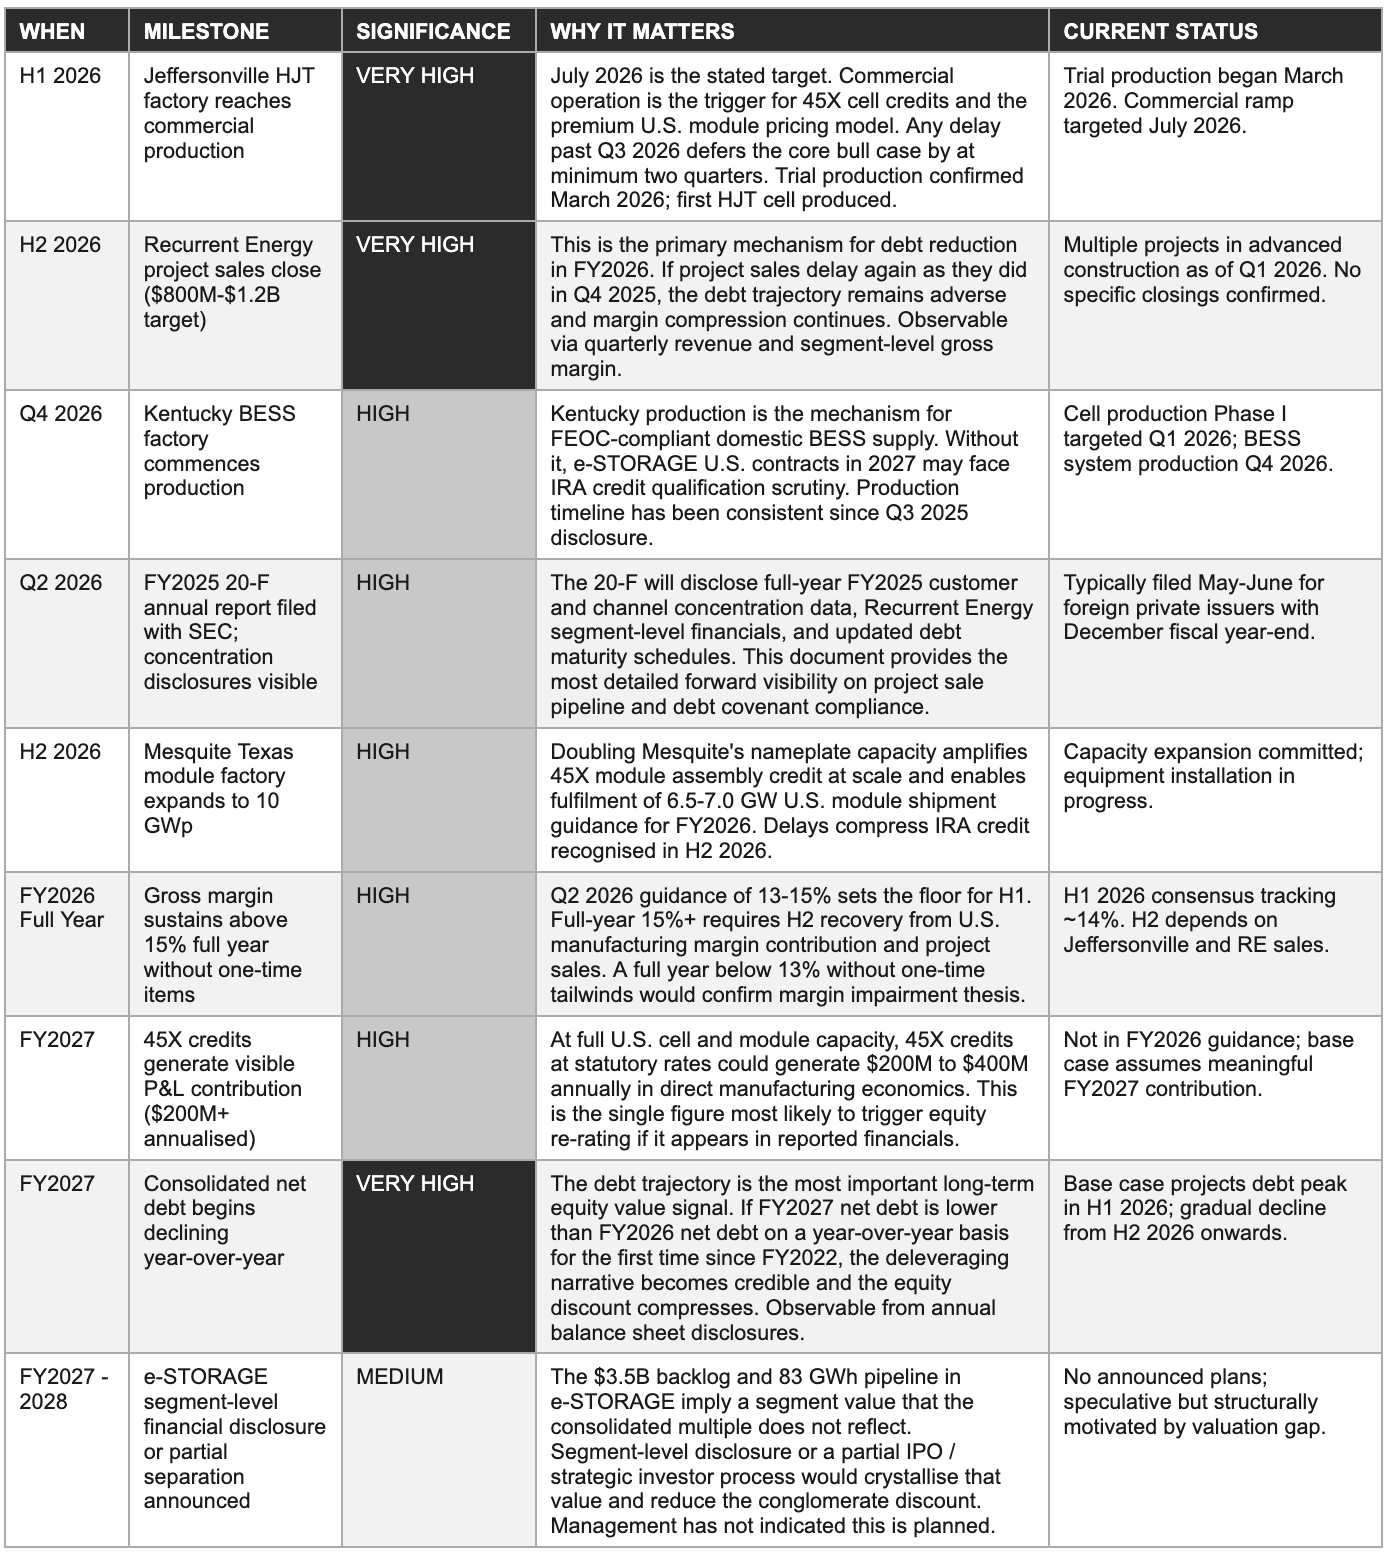
12. Milestone Tracker: What to Watch 2026-2028
The milestones below translate the three scenarios from Section 11 into specific observable proof points. The most significant near-term observations are the Jeffersonville commercial production date, the FY2026 Recurrent Energy project sale cadence, and the Kentucky BESS factory production commencement. These three events, if they execute on schedule, confirm the base case. If two or more slip past their stated timelines, the bear case probability rises materially.
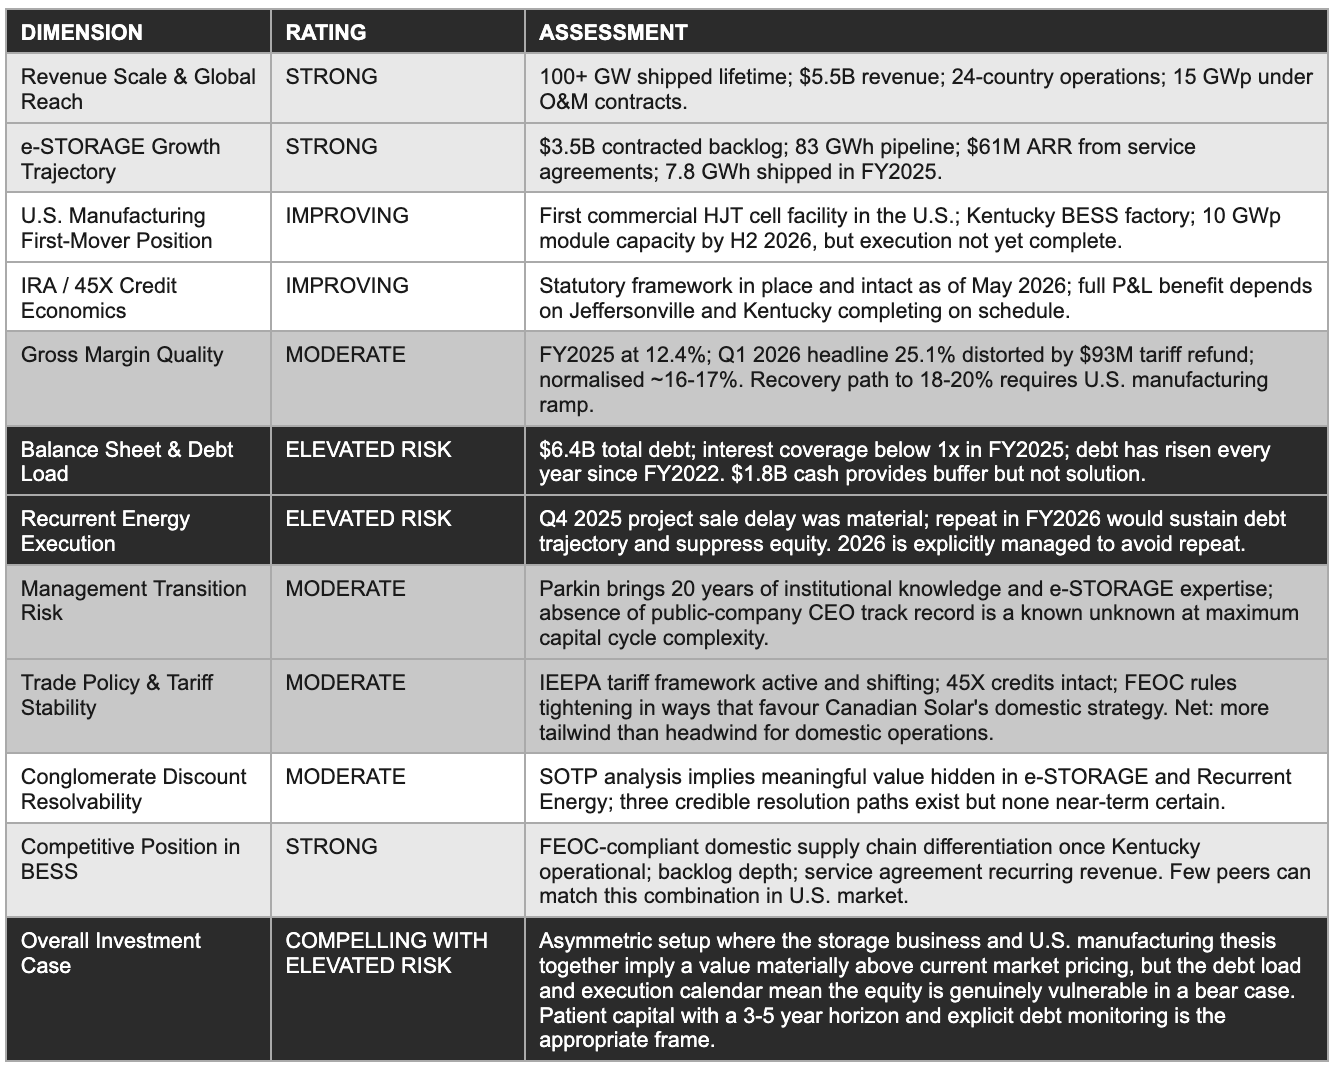
13. Investment Scorecard & Opinion: Bull, Base, and Bear
What follows is our view as of late May 2026. The bull case and bear case are given equal analytical weight because the structural risks in this business are real and not dismissable. At a market capitalisation that implies the market has priced a sustained impairment, the analytical discipline is to calculate explicitly what recovery requires, and to assess honestly whether that recovery path is probable or merely plausible.
Investment scorecard
The bull case: Three requirements
The bull case for Canadian Solar is not a forecast, it is a set of conditions that, if met, would produce equity returns materially above the market’s current implied expectation. The three requirements are specific and observable.
First, the Jeffersonville HJT cell factory must reach commercial production by Q3 2026 and ramp to meaningful volume by Q4 2026, generating 45X credit economics that are visible in reported gross margins and confirming the company’s first-mover position in domestic silicon solar cell manufacturing.
Second, Recurrent Energy must close at least $800 million to $1.2 billion in project sales during FY2026, initiating the debt reduction cycle that is the prerequisite for the balance sheet improving rather than deteriorating further.
Third, e-STORAGE contracted backlog must continue growing, toward $4.0 billion and beyond, confirming that the storage demand cycle is secular rather than episodic and providing the revenue visibility that justifies a higher consolidated multiple.
If these three conditions are met, the path to equity re-rating is through the 45X credit economics becoming visible in reported financials, the debt trajectory turning negative on a year-over-year basis for the first time since FY2022, and the storage franchise being increasingly priced on forward earnings rather than on the current depressed multiple. The bull case share price target over a three-to-five year horizon, using a 5x to 6x EV/Revenue multiple on $8.5 to $9 billion of projected FY2028 revenue, is consistent with a market capitalisation in the range of two to three times current levels, but requires all three conditions to resolve favourably on schedule.
The base case: Conservative recovery with debt overhang
The base case assumes management’s Q2 2026 guidance is directionally accurate, that Jeffersonville reaches commercial production approximately on the July 2026 timeline with some execution friction in the yield ramp, that Recurrent Energy executes project sales in H2 2026 though at the lower end of the targeted range, and that e-STORAGE backlog continues growing at a pace consistent with the Q4 2025 and Q1 2026 run rates.
Under this scenario, FY2026 full-year gross margin lands in the 14% to 16% range, net debt begins declining from its H1 2026 peak, and the company reports a reduced but still material net loss for FY2026, with FY2027 the first year in which net income turns modestly positive on a full-year basis.
The base case equity return at a three-to-five year horizon is modest from the current valuation, perhaps 50% to 100% appreciation, because the debt overhang and the multiple compression from FY2023-2025 accumulated losses are slow to resolve. The base case is investable for patient capital but does not generate the return that most equity growth mandates require.
The bear case: The debt trap
The bear case is direct and must be taken seriously. If Jeffersonville’s production ramp is delayed past Q4 2026 due to equipment or yield issues, if Recurrent Energy project sales slip again as they did in Q4 2025, and if module prices face a further 10% to 15% decline from current levels, all three of which are individually plausible though not the base expectation, the consolidated gross margin stays below 13% through FY2026 and FY2027, operating cash flow remains negative, and debt rises toward $7 billion or beyond.
At that debt level against a cash position that would have declined through continued CapEx spending, the company faces a potential need to access capital markets at a depressed valuation, either through equity issuance or through Recurrent Energy asset sales at distressed pricing. The bear case market capitalisation, applying a 0.1x to 0.15x revenue multiple to a company with negative operating cash flow and rising debt, implies equity value significantly below current levels. The bear case is the scenario the current stock price is partially reflecting, and it deserves the same analytical weight as the recovery thesis.
The bottom line
Canadian Solar’s investment case at its current market capitalisation rests on three propositions: that the U.S. manufacturing capital deployment will generate the 45X-enhanced margins management has implied; that Recurrent Energy’s project development pipeline will monetise in the targeted 2026 window rather than delaying again; and that e-STORAGE’s structural growth is secular rather than cyclical. Each proposition is individually plausible. The risk is their simultaneous failure, which the balance sheet would struggle to absorb without equity dilution.
Investors who purchase at the current capitalisation are accepting the explicit risk that two or more of these propositions fail to resolve on schedule. In exchange, they are acquiring a fractional claim on a $3.5 billion storage backlog, the first domestic HJT cell factory in the United States, a 24-gigawatt project development pipeline, and 25 years of institutional relationships across 24 countries.
The probability-weighted case for patient capital with a three-to-five year horizon is that the current price reflects a temporary convergence of maximum capital deployment, minimum margin realisation, and maximum debt, and that those three forces are each mean-reverting on differentiated timelines. Whether the equity can survive until they do is the question the bear case presses, and the $1.8 billion cash position, plus the Recurrent Energy project sale pipeline, is the answer management is relying upon.
Sources
This report has been prepared using exclusively publicly available information as of May 2026. Primary sources: Canadian Solar Q1 2026 earnings release and earnings call transcript (May 2026, Globe Newswire); Q4 2025 and full-year 2025 earnings release and earnings call transcript (March 2026, Globe Newswire); Q3 2025 earnings release (November 2025, Globe Newswire); Q2 2025 earnings release (August 2025, Globe Newswire); Canadian Solar 20-F annual report for fiscal year 2024 (filed April 2025, SEC EDGAR, File 0001375877); CS PowerTech joint venture formation disclosure (November 2025, SEC Form 6-K); GLP-1 FlexCare and cholesterol programme press releases where applicable; Omada for Cholesterol press release (February 2026, Globe Newswire); U.S. Patent Trial and Appeal Board final written decisions on Trina Solar TOPCon patent challenges against Canadian Solar subsidiaries (April 2026, USPTO PTAB); Morningstar shares outstanding and market data (May 2026); Stockanalysis.com revenue history and segment data; Bloomberg NEF module price index references (Q1 2026); Wood Mackenzie U.S. utility-scale solar and storage market data (2025 annual report); Lawrence Berkeley National Laboratory Utility-Scale Solar report (2025 edition); U.S. Department of Energy Advanced Manufacturing Production Credit (45X) statutory text and IRS guidance; IRA FEOC framework as codified in 26 U.S.C. § 30D and related Treasury guidance (2024-2025); IEEPA solar tariff proclamations and Federal Register notices (2025-2026); First Solar, JinkoSolar, and Hinge Health public filings referenced for competitive landscape comparisons.
Disclaimer
This report has been prepared by EAA Partners for informational and educational purposes only. It does not constitute financial advice, investment advice, an offer to buy or sell any security, or a solicitation of any investment decision. Nothing in this report should be construed as a recommendation to buy, hold, or sell shares of Canadian Solar, Inc. (NASDAQ: CSIQ) or any other security. All information is sourced from publicly available materials believed to be reliable as of May, 2026 but is not guaranteed to be complete, accurate, or current. AI tools were used to assist in refining language and improving clarity, as English is not our first language, but all research, analysis, and conclusions are our own.