PLANET LABS PBC
Earth Intelligence at Scale: The Archive Moat, the Sovereign Turn, and Whether a $12 Billion Market Cap Has Already Priced the Inflection


1. Corporate Profile & The Daily Earth Thesis
Planet Labs PBC is the only company on Earth that photographs the entire land surface of the planet every single day. That sentence is both a marketing claim and a precisely verifiable technical fact, and it is the foundation on which every financial, competitive, and valuation argument in this report rests.
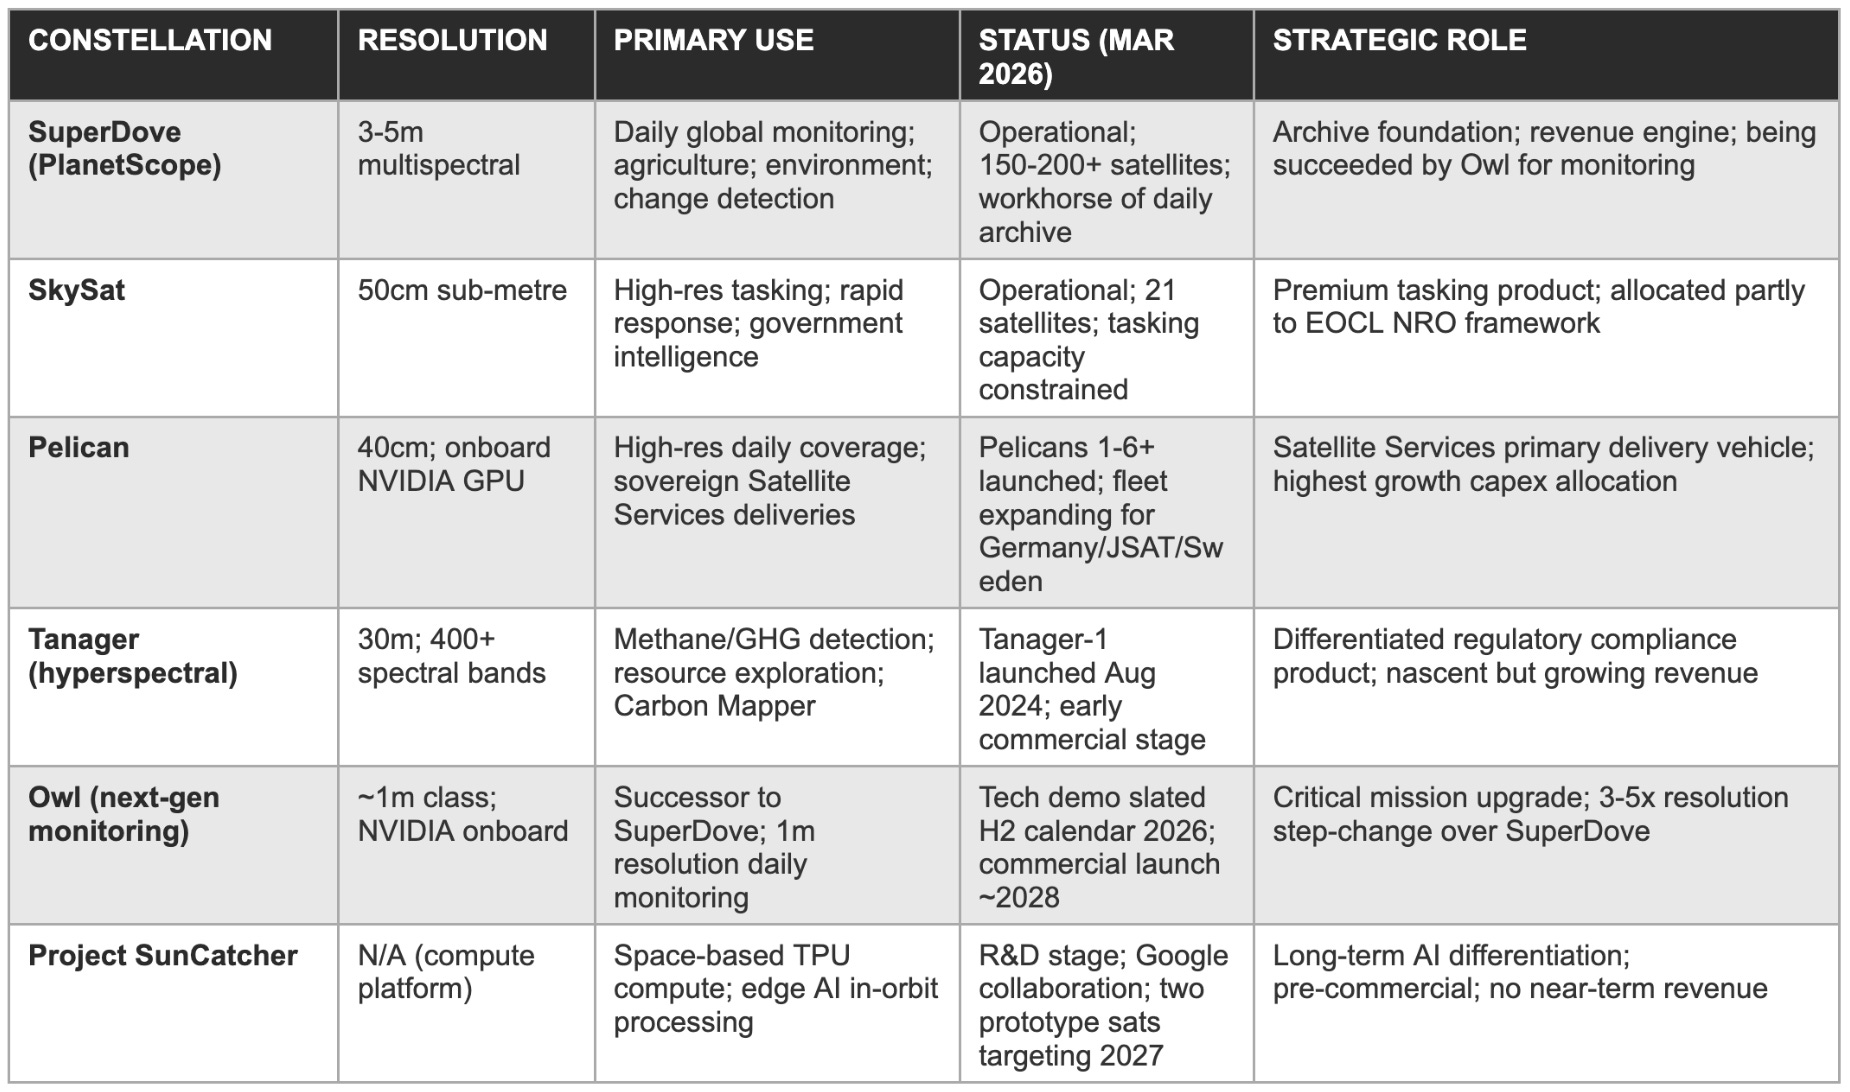
Planet Labs PBC is a corporation that designs, manufactures, launches, and operates the world’s largest commercial Earth-imaging satellite constellation. As of January 2026, Planet’s operational fleet encompasses more than 200 satellites across four constellation families, SuperDove (3-5 metre multispectral), Pelican (40-centimetre high-resolution), Tanager (hyperspectral), and the forthcoming Owl (1-metre class, next-generation monitoring). Combined, these constellations provide near-daily coverage of the Earth’s entire land surface and tens of millions of square kilometres of global oceans, generating petabytes of imagery data per year that is ingested, calibrated, and made available to customers through Planet’s cloud-native Platform API.
The core commercial offering is structured as a data subscription model, customers pay a recurring fee for access to a defined archive, monitoring cadence, or analytics capability rather than purchasing discrete images on a transactional basis. This recurring revenue architecture, combined with the near-zero marginal cost of serving additional subscribers from already-captured imagery, underpins the gross margin trajectory from 54% in FY2022 to 59% full-year FY2026, and it is the origin of the operating leverage the business is only now beginning to demonstrate at material scale.
Management team & PBC governance
CEO Will Marshall has led Planet since founding in 2010 across three distinct phases: NASA-spinout startup (2010-2015), enterprise commercialisation (2015-2021), and institutional and sovereign scaling (2021-present). CFO Ashley Johnson, who joined in 2021, demonstrated notably transparent guidance communication through FY2026, proactively flagging the gross margin compression expected in FY2027, walking back initial characterisations of the Google SunCatcher partnership during the Q4 earnings call, and describing the NRO budget environment as ‘fluid’ rather than deferring uncertainty.
The public benefit corporation legal structure under Delaware law formally obligates the board to balance shareholder returns against Planet’s stated public benefit purpose. Investors who model Planet purely on near-term financial metrics without accounting for this mission-driven capital allocation philosophy will systematically miscalibrate management’s willingness to accept lower near-term margins in exchange for strategic positioning in civil government and environmental monitoring markets with longer-term relationship value, as was visible in the Norway NICFI programme pricing decisions.
The three-market TAM structure
Sizing Planet’s addressable market as a monolithic EO figure obscures the structural bifurcation that drives revenue growth above headline market growth rates. The pure imagery subscription market, where Copernicus and commodity competitors constrain pricing, grows at approximately 3-5% CAGR. The analytics and AI-native intelligence market, where Planet’s archive depth creates genuine differentiation, grows at 20-35% annually.
The Satellite Services sovereign market, dedicated constellation capacity as national infrastructure, is an emerging category with no established pricing benchmark, where Planet is effectively defining the market through its commercial activity. Fortune Business Insights estimates the aggregate EO market at $3.9 billion in 2025 growing to $5.1 billion by 2030 at a 5.6% CAGR. Planet’s 26-39% revenue growth reflects concentration in the two high-growth subsegments of a market that appears moderate in aggregate.
The distinction between Planet’s three commercial market segments also has important implications for how investors should model revenue growth going forward. A business that grows DaaS subscriptions at 15% per year while simultaneously signing $200-300M per year of new Satellite Services TCV can sustain aggregate revenue growth well above 30% even as the pure imagery market matures, because the Satellite Services revenue recognition stretches over multiple years and compounds on the existing DaaS base.
The $900M backlog already on hand provides a contractual bridge: regardless of new commercial or sovereign wins in FY2027, approximately $333M of FY2027 revenue is effectively pre-contracted, providing a revenue floor that most growth-stage companies of comparable size cannot credibly demonstrate.
The public benefit corporation structure carries one additional financial dimension that investors occasionally overlook: the PBC designation strengthens Planet’s positioning in civil government and international development procurement processes where mission alignment is an explicit evaluation criterion. The World Bank, the United Nations Environment Programme, and various national environmental ministries evaluate EO vendors partly on the credibility and permanence of their commitment to public benefit use cases.
A PBC cannot strategically abandon its mission without board-level governance change, a structural assurance that mission-driven institutional procurement processes treat as meaningful. This procurement advantage is difficult to quantify but real in practice, and it has likely influenced Planet’s positioning on international development contracts that carry lower per-seat pricing but multi-year tenure and institutional relationship value.
2. Founding Mission & The 15-Year Archive as Irreplicable Infrastructure
A satellite archive is not merely a storage system. It is a temporal ledger of the planet’s surface, every field, every port, every forest, every city, recorded at consistent spectral calibration across an unbroken 15-year time series. Competitors entering the Earth observation market today can build constellations; they cannot purchase historical archives.
Planet was founded on a conviction that contradicted the prevailing aerospace consensus of 2010: that Earth observation was more valuable as a daily, global monitoring capability than as an on-demand, high-resolution tasking service for well-capitalised government customers. The legacy model, dominated by Maxar (formerly DigitalGlobe) and government-operated systems, was built around the proposition that the highest value in EO data derived from sharp, precisely scheduled imagery of specific targets.
Planet’s founders concluded that the analytical value of daily, planet-scale coverage, the ability to observe change over time across any location on Earth, constituted a fundamentally different and underserved capability. The technical vehicle was the CubeSat form factor, which enabled launch frequency and cost structures that allowed maintaining 100-200+ satellites simultaneously. Over 600 satellites have been manufactured and deployed since founding, a production volume that no other commercial EO company has approached.
Why the archive is an accelerating moat
The 15-year daily archive that Planet’s production cadence has created is the deepest competitive moat in its portfolio. A government agency, agricultural analytics firm, or financial data provider seeking to build a change-detection model requiring ten years of consistent, daily, calibrated imagery has exactly one supplier: Planet. A competitor launching a daily-coverage constellation today begins their archive at zero and reaches a five-year archive in 2031 at the earliest.
By then, Planet will hold a 22-year archive. The archive’s competitive value does not grow linearly with each passing year, it grows superlinearly. Each additional year enables longer time-series models, more statistically robust trend detection, and wider-range seasonal baseline calibration. Every day that passes widens the gap by exactly one more day of global imagery, at no incremental cost to Planet.
The archive advantage is most powerful in applications where longitudinal consistency matters more than instantaneous resolution. Agricultural analytics firms monitoring crop development cycles require consistent spectral calibration across seasons and years. Environmental compliance monitoring, tracking deforestation, wetland conversion, and illegal mining, requires a multi-year baseline to distinguish anthropogenic change from natural variation. Climate research applications, including tracking glacier retreat and urban heat island evolution, require decade-scale time series. In each of these use cases, Planet’s archive is the product; the daily imaging is the delivery mechanism.
The agile aerospace manufacturing moat
The agile aerospace manufacturing philosophy Planet pioneered, building satellites in modular, standardised batches on a continuous production line, created a learning curve in satellite production analogous to those documented in automotive and semiconductor industries. Each successive generation of Doves and SuperDoves incorporated on-orbit performance lessons within weeks rather than months.
The resulting manufacturing capability, measured in cost per satellite, design-to-launch cycle time, and post-launch commissioning reliability, is substantially superior to that achievable by any competitor beginning a comparable programme today. This learning curve is not captured in any standard financial metric but is a structural barrier to replication that compounds over time.
The archive-to-AI pipeline
The archive also underpins Planet’s Large Earth Model (LEM) AI initiative, a geospatial foundation model trained on the proprietary archive. The commercial significance is that the LEM can be fine-tuned for specific analytical tasks, detecting shipping container movements, identifying crop stress, monitoring construction activity, flagging changes in military infrastructure, with a historical context that no synthetic dataset can replicate.
This pipeline is the mechanism by which Planet converts raw data infrastructure into defensible analytical product margins, and it is the primary basis for management’s assertion that AI will reaccelerate commercial revenue growth after the current period of government-driven concentration.
Geopolitical context: Why Ukraine changed the demand calculus
The demand signal from the Ukraine conflict has a specific implication for Planet’s product roadmap that validates the founding thesis in a way no commercial use case could have replicated. Governments and militaries that previously prioritised resolution, the ability to identify individual vehicles in a single precisely-scheduled image, discovered that the ability to monitor broad areas continuously and detect activity patterns over time was operationally more useful for tracking a dynamic conflict situation.
This validation has directly influenced European sovereign procurement priorities, which now explicitly specify daily broad-area monitoring alongside high-resolution tasking, precisely the combination that Planet’s SuperDove plus Pelican dual-constellation architecture provides, and which Planet’s competitors offering only tasking satellites cannot replicate at the same geographic scale.
Russia’s sustained military campaign in Ukraine created a commercial satellite imagery demand environment where the combination of high revisit frequency, spectral versatility, and temporal archive depth proved more operationally valuable than the high-resolution-tasking capability that had historically commanded the highest EO procurement premiums. Planet’s SuperDove constellation’s ability to provide daily broad-area monitoring, detecting troop movements, supply line activity, and infrastructure changes across hundreds of thousands of square kilometres simultaneously, aligned precisely with the intelligence requirement that the Ukraine conflict exposed as underserved by legacy EO procurement.
The cascading European government interest in sovereign satellite capability that followed, crystallised in the Germany, Sweden, and NATO contract announcements, was driven in material part by European governments observing Planet’s Ukraine-related operational relevance and concluding that assured, sovereign access to equivalent capability was a national security priority.
The manufacturing learning curve has an additional strategic dimension: Planet’s production volume advantage translates directly into a cost-per-satellite advantage that widens with each successive generation. When Germany contracted for dedicated Pelican capacity, it did so at economics that would have been impossible to achieve by building a sovereign constellation from scratch, partly because of the design maturity of the Pelican platform (incorporating over 600 prior satellite launches of lessons), and partly because Planet’s production line efficiency, honed over a decade of continuous operation, delivers a cost per satellite that a new-entrant manufacturer cannot replicate within any realistic contractual timeline.
This cost structure advantage is the commercial foundation of the Satellite Services model: Planet can offer governments a cost-effective and fast pathway to sovereign space capability precisely because its manufacturing cost base is structurally below what any competitor starting fresh can achieve.
The geopolitical context has also accelerated the commercial viability of Planet’s civil and environmental monitoring programmes. Climate monitoring, deforestation tracking, and environmental compliance verification, all of which require the longitudinal archive depth that Planet uniquely possesses, have moved from discretionary government spending to treaty-mandated and regulatory-required activities in the period between 2020 and 2026.
The Paris Agreement’s Article 13 transparency framework, the Kunming-Montreal Global Biodiversity Framework’s land monitoring requirements, and the EU’s deforestation regulation all create demand for satellite-based verification that Planet’s archive is uniquely positioned to serve. These regulatory demand drivers represent a structurally growing market for Planet’s civil government revenue base that partially offsets the agricultural sector headwinds that contributed to commercial revenue pressure in FY2026.
3. The One-to-Many Business Model & DaaS Economics
Once a satellite passes over a location and captures an image, the marginal cost of delivering that image to any number of additional subscribers is approximately zero. This economic property, one capture, many sales, is the structural origin of Planet’s gross margin expansion story and the most powerful argument for the business model’s long-term profitability.
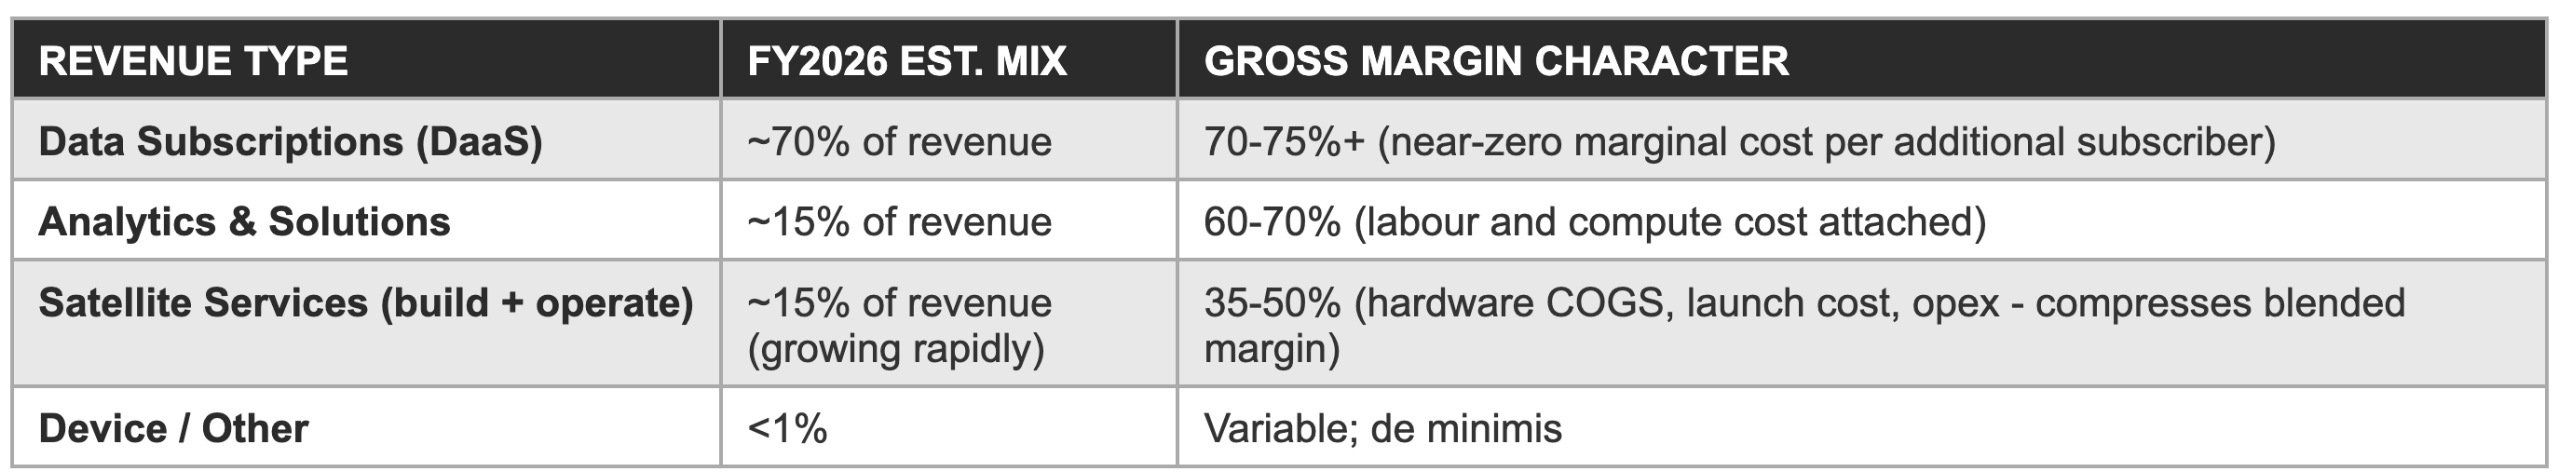
Planet’s revenue architecture divides into three primary categories: data subscriptions (DaaS), analytics and solutions, and Satellite Services. Each carries a materially different gross margin profile, and the evolution of the revenue mix between these three categories is the central driver of the gross margin trajectory through FY2028. The DaaS subscription model is the foundation.
A customer enters into a multi-year contract that grants access to Planet’s archive and ongoing imagery coverage for a defined geography, resolution, and cadence. The annual contract value is fixed and paid regardless of how many images the customer accesses. The primary cost is satellite fleet operation, which scales with constellation size, not customer count. Once the fleet is operational, each additional subscriber adds revenue with near-zero incremental COGS.
Revenue mix and margin architecture
The practical consequence is that DaaS gross margins are structurally high, Planet estimates pure-data subscription margins above 70% when stripped of allocated hardware costs. The blended FY2026 gross margin of 59% reflects the drag from Satellite Services revenue, which carries significantly lower gross margins because it includes the hardware cost of satellite manufacturing, integration, launch, and operational overhead recognised as COGS against contract revenue.
Management’s FY2027 gross margin guidance of 50-52% reflects a further compression as Satellite Services revenue, recognition of which ramps as the Germany, JSAT, and Sweden contracts move through delivery milestones, becomes a larger share of total revenue mix.
The unit economics of a mature DaaS relationship improve substantially over the contract lifecycle, driven by three compounding mechanisms.
First, the customer’s analytics workflows become more deeply integrated with Planet’s specific imagery format, calibration standard, and archive structure over time, increasing switching costs and reducing churn probability at each renewal cycle.
Second, the natural expansion of monitored geography and analytical use cases within a customer account increases ACV per customer as the operational value of monitoring expands beyond initial use cases.
Third, the transition from raw imagery access to analytics product access, triggered by the deployment of AI-native solutions on top of the archive, carries a significant ARPU premium.
A government customer that began as a $500,000 per year PlanetScope imagery subscriber can evolve into a $2-3 million per year AI-enabled maritime domain awareness or border monitoring analytics customer using the same underlying dataset, a revenue expansion that requires no new satellite infrastructure investment.
Revenue mix estimates are proprietary estimates based on management commentary across Q3 and Q4 FY2026 earnings calls. Planet does not separately disclose Satellite Services revenue as a standalone segment in its current financial reporting framework.
The satellite services model: Capex conversion
The Satellite Services category requires specific analytical treatment because it changes the economic character of the business in ways that aggregate gross margin figures obscure. Under a Satellite Services contract, as with Germany (€240M), JSAT ($230M), and Sweden (low nine-figure), the sovereign customer co-finances satellite construction, pays for operational capacity over the contract term, and in some structures takes legal title to the satellites while Planet retains rights to commercialise excess imaging capacity. This model converts what would otherwise be Planet’s capex obligation into a customer-funded activity.
The customer pays for satellite construction; Planet deploys the asset, operates it, and retains data commercialisation rights over excess capacity. The trajectory from FY2027’s guided 50-52% gross margin back toward 65%+ in FY2028-FY2029 is contingent on this mix shift within the Satellite Services category, from construction-phase recognition toward service-phase recognition, which carries higher margins.
Customer retention and pricing dynamics
Planet’s DaaS net revenue retention, while not separately disclosed, is estimated by us at approximately 100-115% based on management’s description of expanding contract scope within existing accounts. This level is consistent with a subscription data product that embeds deeply into customer workflows, carries high switching costs (customers have built analytical pipelines on Planet’s specific imagery format and calibration standard), and has a natural upsell pathway through product tier upgrades, analytics additions, and coverage area expansions.
A 110% NRR on the existing DaaS base implies that the existing customer base collectively generates approximately $15-30M of organic expansion revenue annually, partially offsetting new customer acquisition requirements and making the DaaS segment naturally self-compounding. Additionally, as Planet’s mix shifts toward D&I and Satellite Services customers, who command premium contract values versus the commodity civil government pricing, the revenue per customer metric improves structurally even before volume growth is considered.
Operating leverage: The long-run margin picture
The DaaS model has a specific implication for customer acquisition cost efficiency that compounds over time. Planet’s existing customer relationships, built through 15 years of enterprise sales and government procurement engagement, represent a customer acquisition cost that has already been paid. Expansion revenue generated within an existing account (additional imagery tiers, analytics overlays, coverage area expansions) carries an incremental customer acquisition cost approaching zero.
This is the mechanism behind the high net revenue retention that management characterises as a core commercial strength: the enterprise sales infrastructure, customer success relationships, and technical integration that support an existing account are shared across all revenue generated from that account, making each additional dollar of expansion revenue structurally more profitable than the first dollar of new customer revenue. The commercial AI platform strategy, which targets existing customers as the primary early adopters of analytics products built on their existing archive subscriptions, is designed to leverage exactly this dynamic.
The platform economics of the one-to-many model have a specific implication for operating leverage that differs from traditional software SaaS. In software SaaS, each new customer requires marginal server capacity, customer success staffing, and integration support. In Planet’s DaaS model, the primary cost driver is constellation operation, essentially fixed relative to customer count. The operating cost that scales with customer count is the analytics and solutions delivery layer.
As Planet moves toward AI-native analytics, the proportion of variable-cost delivery decreases and the proportion of fixed-cost AI platform delivery increases, further improving the operating leverage of incremental revenue above the constellation’s fixed cost base. This dynamic is the mechanical foundation of the long-term 20%+ EBITDA margin target that management has articulated, and which the base case financial model projects achieving in FY2028.
4. The Institutional Revenue Architecture, Sovereign Services & Defense Intelligence
The Satellite Services model is a structural innovation that has changed the economics of how Planet builds its constellation. Sovereign customers now fund the hardware expansion that Planet would otherwise finance through dilutive equity issuance, while Planet retains the right to monetise excess capacity. The result is a capital structure transformation disguised as a contract announcement.
Planet’s Defense and Intelligence segment grew more than 50% year-over-year in FY2026, with Q3 FY2026 alone growing over 70% YoY per the December 2025 earnings call, making it the fastest-growing segment in the company’s operating history and the primary driver of FY2026 outperformance versus initial guidance.
Management cited strong usage growth from existing NRO, NGA, Navy, and allied government customers, alongside new wins from NATO, the DIU, and the SHIELD IDIQ vehicle. CEO Marshall described European demand on the Q4 FY2026 call as ‘off the charts’, a characterisation supported by both the volume of new contract announcements and the geopolitical urgency of European governments prioritising sovereign space intelligence capability.
The sovereign satellite services contract stack
The JSAT, Germany, and Sweden deals collectively represent over $500 million in contracted Satellite Services value signed in approximately 12 months. Planet confirmed on the Q4 FY2026 call that the pipeline of sovereign conversations is growing in both number and average deal size, with Marshall describing interest from additional European nations and the SHIELD IDIQ as an early indicator of potential US government engagement. The contract table below summarises the material institutional relationships disclosed publicly as of March 2026.
The structural innovation of the sovereign co-financing model deserves comparison to analogous financing structures in other capital-intensive industries. The model resembles build-operate-transfer (BOT) arrangements in infrastructure, where a private entity builds a facility using a combination of customer prepayment and its own capital, operates it under a long-term service agreement, and retains residual commercialisation rights. In Planet’s case, the ‘facility’ is a set of satellites; the ‘service agreement’ is a multi-year data and operational services contract; and the ‘residual commercialisation rights’ are the ability to sell imagery from those satellites outside the customer’s designated area of interest.
The key difference from traditional BOT is the data monetisation right, Planet’s Pelican satellites serving Germany over European airspace generate imagery of the broader European region during their orbital passes, and Planet retains the right to sell that additional imagery to commercial subscribers and other government customers. This means each Satellite Services deal is simultaneously a capital injection for constellation expansion and a new recurring revenue source from excess capacity.
The European Advisory Board and Defense and Intelligence Advisory Board announced at the February 2026 Munich Security Conference represent a deliberate institutional positioning strategy that mirrors the accreditation-stack approach used by healthcare IT companies seeking inclusion in institutional procurement channels. By assembling advisory boards of credible former European defence officials, Planet signals to European governments that its commitment to European security is institutionalised and culturally aligned with the procurement requirements of the European defense establishment.
These advisory relationships carry no disclosed financial commitment but function as procurement channel infrastructure: they create warm introductions to procurement decision-makers, provide intelligence on upcoming tender processes, and give Planet representatives credibility in ministry-level procurement conversations that a purely commercial technology company would not otherwise access. The Munich Security Conference choice of venue was also deliberate, it is the annual gathering point of European defense and security decision-makers, providing Planet with simultaneous access to the procurement pipeline across multiple sovereign market conversations.
The RPO disclosure at $852.4 million as of January 31, 2026, up 106% year-over-year, provides a contractual underpinning for the FY2027 revenue guidance that few growth companies of comparable size can match. RPOs under ASC 606 represent contractually committed future revenue that has not yet been recognised, they are on-balance-sheet obligations that the company is contractually required to fulfil. Approximately 34% of the $852.4M in RPOs converts to recognised revenue in the next 12 months (approximately $290M), supplemented by new contract wins to reach the $415-440M full-year guidance range.
The math is internally consistent: $290M from existing RPOs plus approximately $130-150M from new contracts signed in FY2027 reaches the guidance midpoint without requiring heroic assumptions. This backlog-to-guidance coverage ratio is a structural feature of the Satellite Services model that traditional DaaS-only companies cannot replicate, and it represents a genuine reduction in the guidance miss risk that the bear case requires to materialise.
Capital engineering: How sovereign deals fund fleet expansion
The structural insight in the Satellite Services model: Planet’s customers are funding the same constellation expansion that Planet would otherwise need to finance through equity dilution. The capital efficiency benefit compounds over time, each additional Satellite Services deal converts future capex into contracted customer revenue, improving free cash flow generation without requiring incremental equity issuance.
The Germany contract structure as disclosed provides the most detailed publicly available template for understanding how Satellite Services economics work at scale. The €240 million ($265 million) value spans multiple years of revenue recognition, beginning in January 2026 and ramping as satellites are manufactured, launched, and commissioned.
The contract includes multiple components: dedicated Pelican capacity (manufacturing and launch of satellites that Germany has priority tasking rights over), direct downlink access (Germany’s own ground stations receiving imagery directly rather than routing through Planet’s cloud infrastructure), PlanetScope and SkySat archive access (subscription-style access to Planet’s broader daily imagery coverage), and AI-enabled solutions for situational awareness and maritime domain awareness. Each component carries a different gross margin profile: dedicated capacity manufacturing is construction-phase COGS-intensive, while archive access and AI solutions are high-margin recurring service revenues.
The blended gross margin on the Germany contract over its full term is likely in the 45-55% range, above the contract’s construction-phase margin but below the pure DaaS margin, and it improves each year as the construction-phase revenue recognition completes and the ongoing service-phase revenues dominate the contract’s P&L contribution.
Under the sovereign contracts, customers make milestone-based payments tied to satellite manufacturing and delivery progress, cash is received before revenue is recognised, generating a working capital benefit during the construction phase. This prepayment structure contributed to FY2026’s positive free cash flow of $52.9 million even as EBITDA was only $15.5 million. Furthermore, even when Sweden owns the satellites under the dedicated capacity model, Planet retains the right to commercialise excess imaging capacity outside Sweden’s area of interest, creating recurring revenue from the same hardware after the construction payment has been received.
Management confirmed on the Q4 FY2026 call that it is doubling satellite manufacturing capacity specifically to address the sovereign pipeline. The Munich Security Conference in February 2026 saw Planet launch both a European Advisory Board and a D&I Advisory Board, composed of former government and military leaders, functioning as procurement channel infrastructure that accelerates sovereign conversation-to-contract conversion rates.
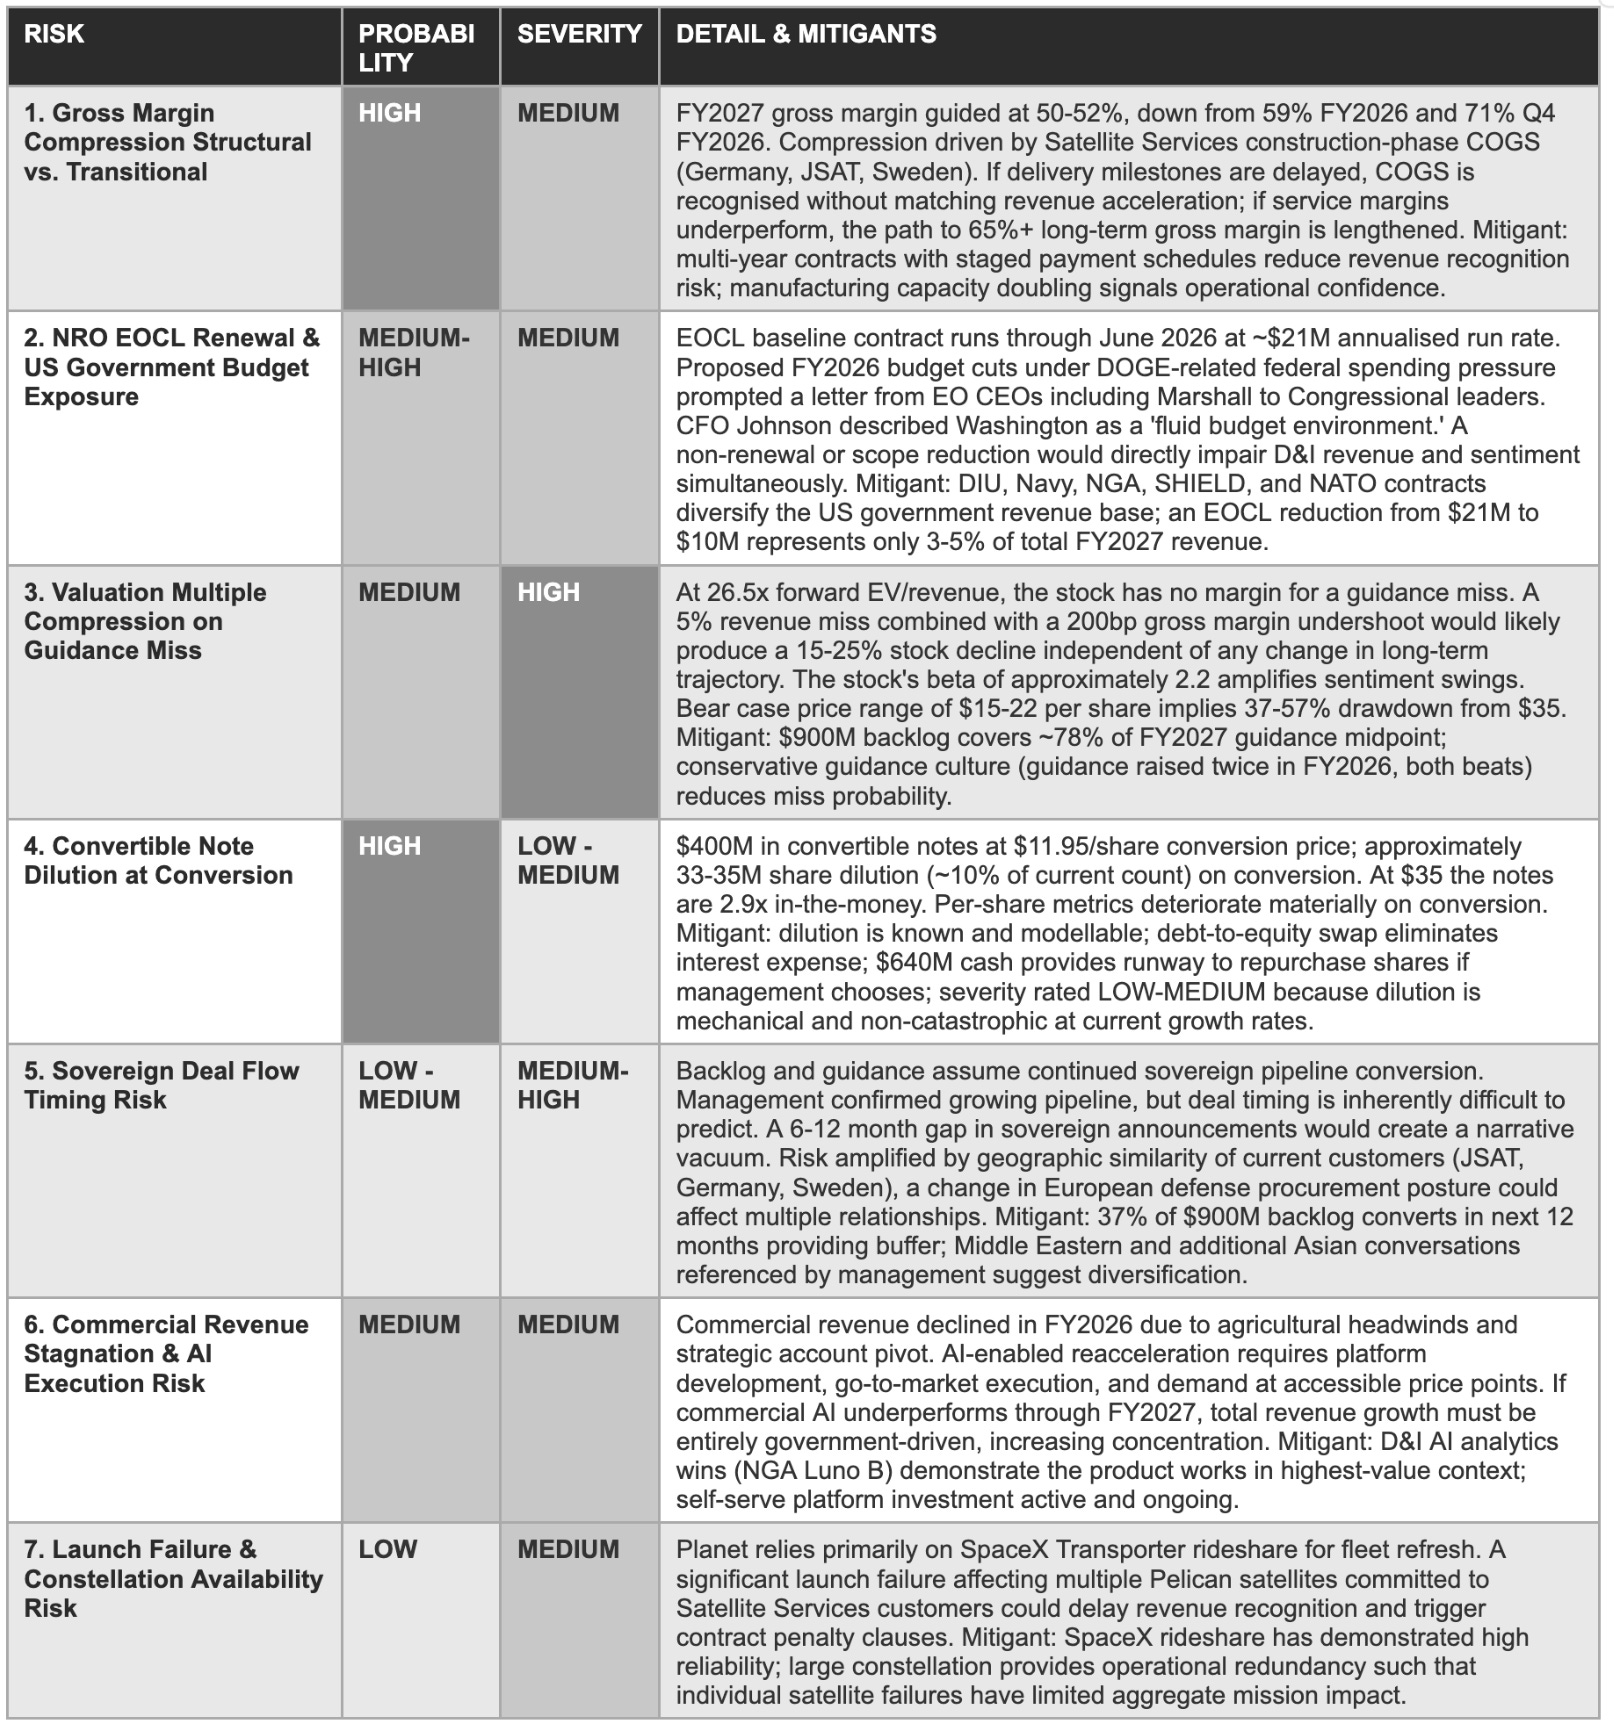
NRO EOCL: The unresolved concentration risk
The NRO EOCL baseline contract runs through June 2026 at an annualised run rate of approximately $21.1 million. The program has faced proposed FY2026 budget cuts under federal spending pressure, with CEO Marshall co-signing a letter to Congressional leaders alongside other EO company CEOs highlighting the risk. CFO Johnson described the Washington environment as ‘fluid.’ The NRO renewed the baseline for $13.2 million through June 2026 and added a CLIN framework for Pelican high-resolution imagery, a partial resolution that extended the runway but left the post-June 2026 trajectory uncertain.
An EOCL non-renewal or significant scope reduction would directly impair D&I revenue and compound sentiment pressure. The mitigant is that D&I revenue is distributed across a larger number of contract vehicles, NGA, Navy, DIU, SHIELD, NATO, and allied government data agreements, than the public focus on EOCL alone implies. A reduction from $21M to $10M annually would represent approximately 3-5% of total company revenue at FY2027 scale: real, but manageable rather than existential.
The unit economics of D&I contracts, while not separately disclosed by Planet, can be estimated from management commentary and contract-level disclosures. The NRO EOCL baseline at approximately $21M annualised represents a single contract vehicle among a broader portfolio that includes NGA, Navy, DIU, SHIELD, NATO, and various allied government data agreements. The implication is that D&I revenue is distributed across more contract vehicles than the public focus on EOCL alone implies, a distribution that is analytically constructive because it reduces the impact of any single contract reduction on aggregate D&I revenue.
An EOCL reduction from $21M to $10M annually would represent approximately 3-5% of total FY2027 revenue at the $427M guidance midpoint: material enough to register in reported results and sentiment, but manageable rather than existential when the remaining D&I revenue base is considered. This nuance is important for investors who may be tempted to model EOCL as the sole determinant of D&I revenue trajectory, the segment has grown well beyond dependence on any single US government contract vehicle.
Planet federal: The cleared subsidiary advantage
Planet Federal, Planet’s US government-cleared subsidiary, holds the facility and personnel clearances necessary to bid on and perform contracts requiring access to classified information, a prerequisite for many of the highest-value NRO, NGA, and NSA procurement opportunities. This cleared subsidiary structure allows Planet to compete across the full spectrum of US government EO requirements, from unclassified civil government programmes to classified intelligence support, without subjecting the entire commercial business to security clearance overhead.
This structural differentiation is meaningful relative to smaller EO competitors that lack the resources to maintain a cleared subsidiary, and it was instrumental in Planet’s role as prime contractor on the NGA Luno B AI-enabled maritime domain awareness award.
5. Financial History & The FY2026 Inflection - From Chronic Loss to Cash Generator
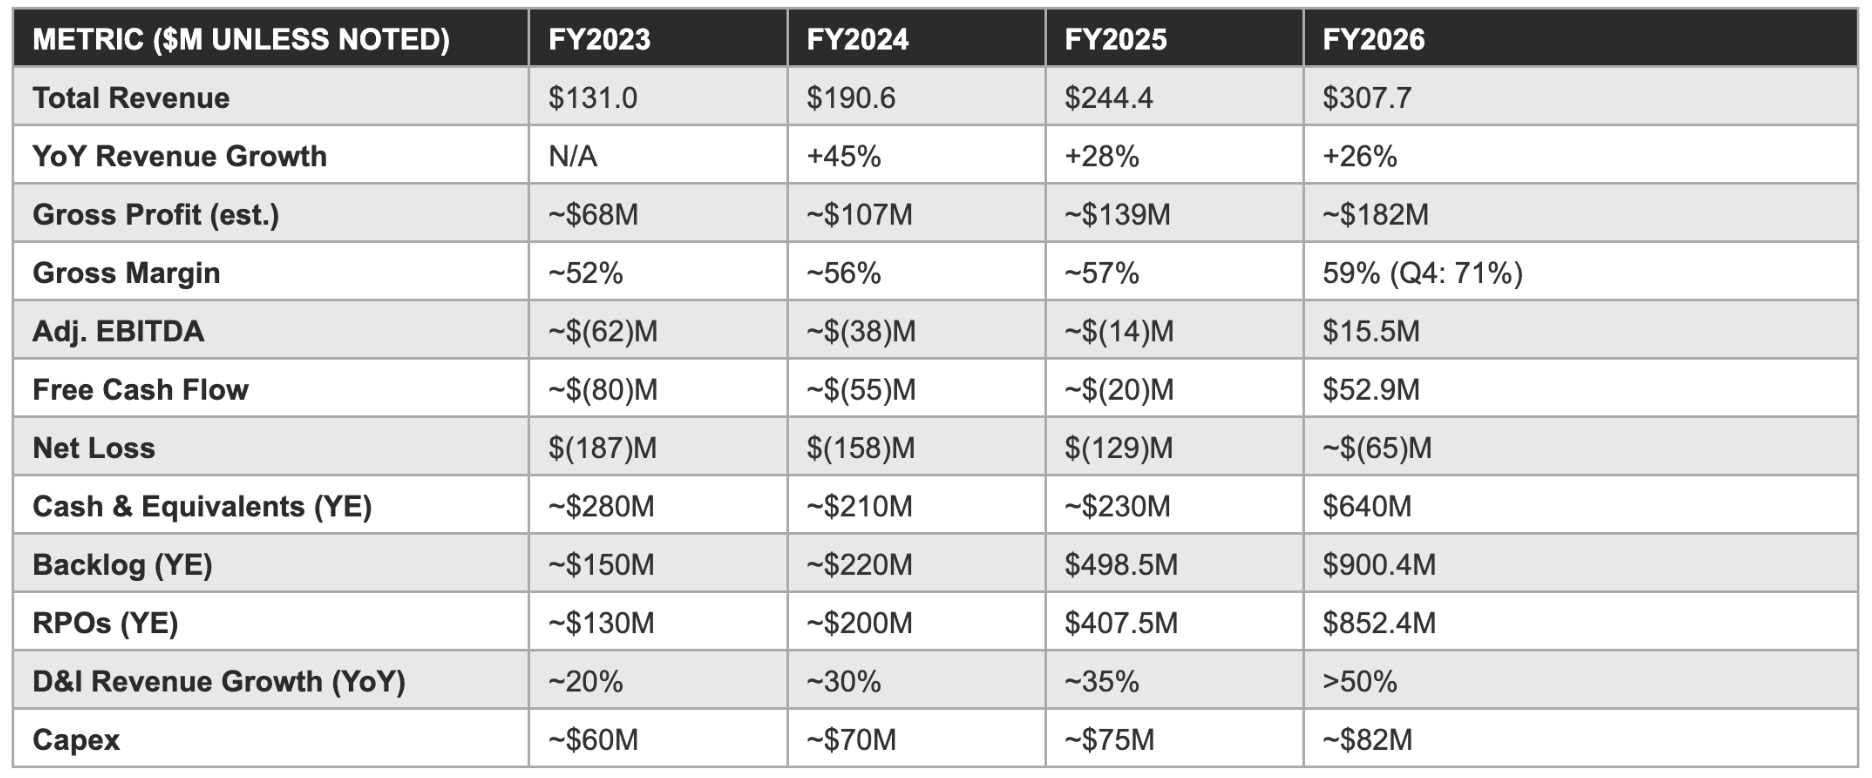
Four consecutive years of accelerating absolute dollar revenue growth, from $131M in FY2023 to $307.7M in FY2026, coupled with the first full-year positive adjusted EBITDA and free cash flow in the company’s operating history, establish that the Planet business model generates operating leverage at scale. The central forward question is whether that leverage is durable given the gross margin compression that will characterise FY2027 as Satellite Services revenue ramps its highest-COGS construction phase.
Revenue growth in percentage terms has been consistent but not spectacular: 45% in 2024, 28% in 2025, 26% in FY2026. The percentage deceleration is arithmetically inevitable as the revenue base scales, and the absolute dollar growth tells a more compelling story of $59.6M added in 2024, $53.8M added in 2025, $63.3M added in FY2026. The FY2027 guidance midpoint of $427.5M implies approximately $120M of absolute revenue addition, nearly double the FY2026 absolute addition, making FY2027 the first year in which absolute dollar growth is accelerating while the percentage base grows simultaneously.
Income statement progression: FY2023 through FY2026
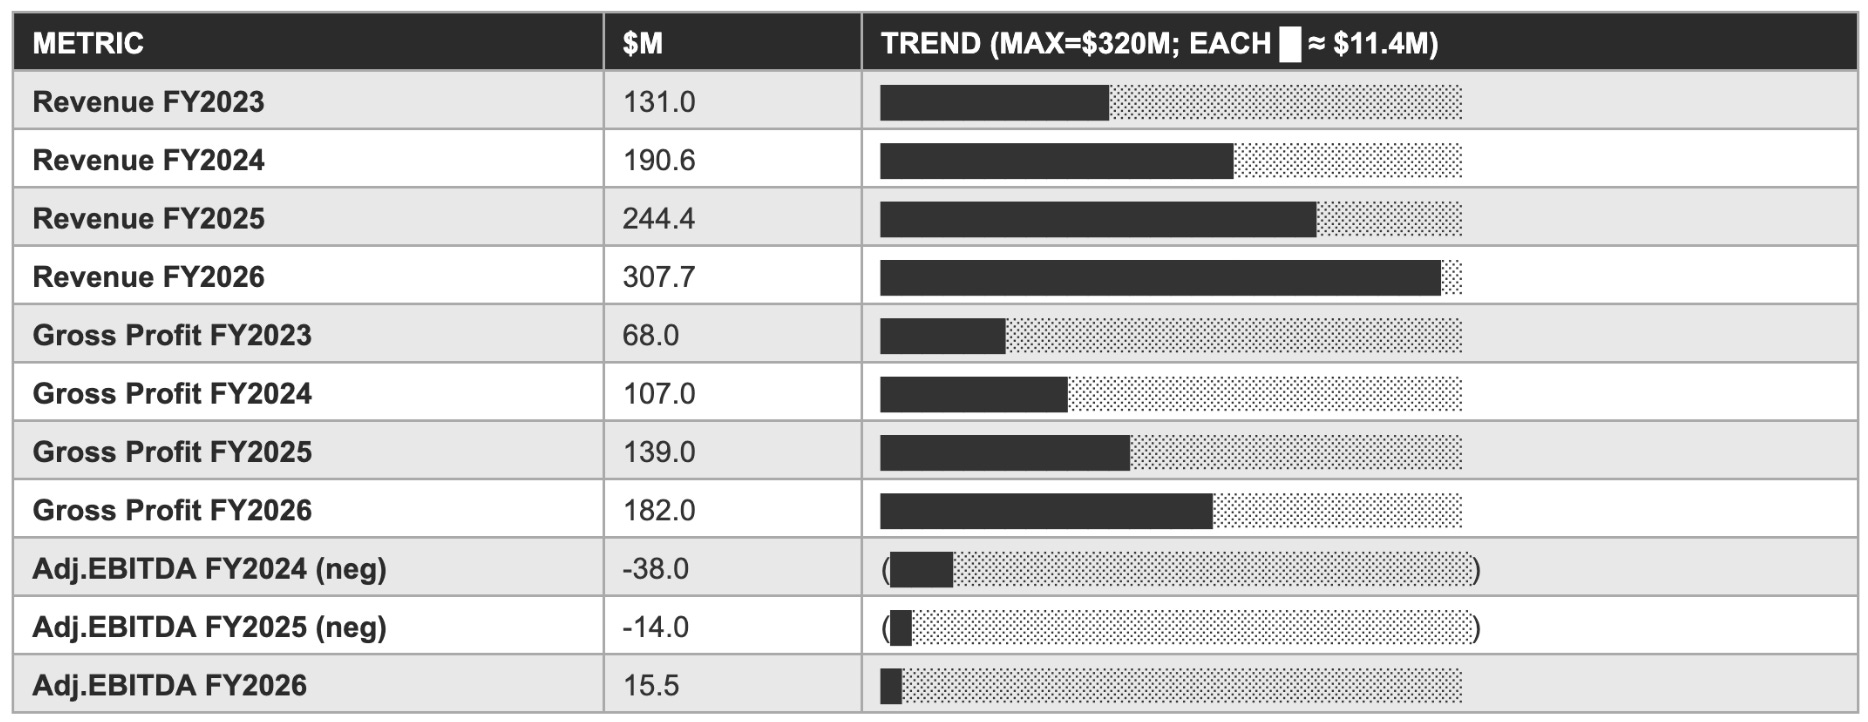
Revenue and gross profit trend: Visual comparison
The RPO metric warrants specific analytical attention because it is subject to audit verification under ASC 606, making it a more conservative and auditable representation of contracted future revenue than the backlog figure management uses in investor communications. The $852.4 million in RPOs at January 31, 2026 reflects only the portion of contracted value that meets the strict ASC 606 criteria for recognition as a performance obligation: the contracts are enforceable, the transaction price is estimable, and the performance obligations are identifiable.
The gap between the $852.4M RPO figure and the $900.4M backlog figure ($48M) represents contracts with termination-for-convenience clauses that management includes in backlog but that do not qualify for RPO recognition under accounting standards. This $48M gap is small relative to total backlog and suggests that the vast majority of Planet’s contracted revenue base carries the enforceable commitment characteristics that underpin RPO recognition.
EBITDA Operating leverage: The $29.5M swing
The adjusted EBITDA improvement from negative $14M (FY2025) to positive $15.5M (FY2026), a $29.5M year-over-year swing, is the most important financial milestone in the company’s public history. It demonstrates that operating leverage exists at current revenue scale: as revenue grew $63.3M, adjusted EBITDA improved $29.5M, implying an incremental EBITDA conversion rate of approximately 47%. CFO Johnson disclosed this specific ratio on the Q4 FY2026 earnings call, confirming it is structural: as revenue grows faster than operating expenses, the EBITDA margin expands arithmetically.
The trajectory from 5% adjusted EBITDA margin in FY2026 toward management’s long-term 20%+ target is credible given the scale of the revenue base against which that leverage compounds, but it requires the gross margin to recover from FY2027’s guided 50-52% trough back toward 65%+ as Satellite Services construction transitions to service phase.
The FY2026 gross margin trajectory conceals an important intra-year pattern: Q1 started below 55%, and Q4 reached 71%, the highest quarterly gross margin in company history. This Q4 peak reflects a revenue mix weighted toward high-margin DaaS and analytics rather than Satellite Services construction-phase recognition. FY2027 guidance of 50-52% represents a deliberate step backward from that peak, as the Germany, JSAT, and Sweden contracts enter their highest-COGS delivery phases. Analytically, the 50-52% level is a construction-year trough rather than a structural deterioration, but the risk that the market reads it as the latter is among the primary sentiment risks identified in the Risk Matrix.
The quarterly gross margin trajectory through FY2025 and FY2026 reveals a pattern that is analytically important for modelling the FY2027 compression and FY2028 recovery. In FY2025 (ended January 2025), gross margin averaged approximately 57% for the year but was heavily skewed toward the second half as the mix of high-margin DaaS renewed ahead of lower-margin Satellite Services construction revenue. In FY2026, the Q1-Q4 trajectory moved from approximately 54-55% (Q1) to 71% (Q4), a 16-17 percentage point intra-year range.
FY2027 is expected to invert this pattern: Q1 FY2027 guided at 49-51% gross margin as Satellite Services construction-phase costs are front-loaded relative to the delivery and service-phase revenues that will begin recognising more fully in H2. Investors who evaluate Planet’s Q1 FY2027 gross margin in isolation, without accounting for the structural back-half loading of the Satellite Services revenue mix, will misread the 49-51% Q1 figure as confirmation of structural deterioration when it is, in fact, a predictable consequence of the contract delivery schedule. The correct analytical lens for FY2027 is full-year gross margin against the 50-52% guided range, not the Q1 trough as a standalone data point.
The Rule of 40 achievement reported by management for Q4 FY2026 and on an annual basis for FY2026 is a metric that carries specific significance in enterprise software valuation frameworks. Rule of 40 is conventionally used to screen high-quality SaaS companies: businesses that sustain Rule of 40 performance over multiple years typically attract premium EV/Revenue multiples relative to businesses at comparable growth rates with lower profitability. Planet management stated on the Q4 FY2026 call that it aims to deliver Rule of 40 on a full-year basis for FY2027, meaning that 39% revenue growth plus approximately 1% EBITDA margin equals 40, which is precisely the midpoint of the FY2027 guidance range.
Rule of 40 is a necessary but not sufficient condition for the premium multiple Planet currently trades at; sustaining it through the gross margin compression year while simultaneously building the Owl and AI platform capabilities is the execution discipline that would validate the technology-grade multiple premium. A failure to achieve Rule of 40 in FY2027, either through revenue growth below 30% or EBITDA below breakeven, would remove a key multiple-support metric and accelerate the multiple compression scenario embedded in the bear case.
Cash position and convertible structure
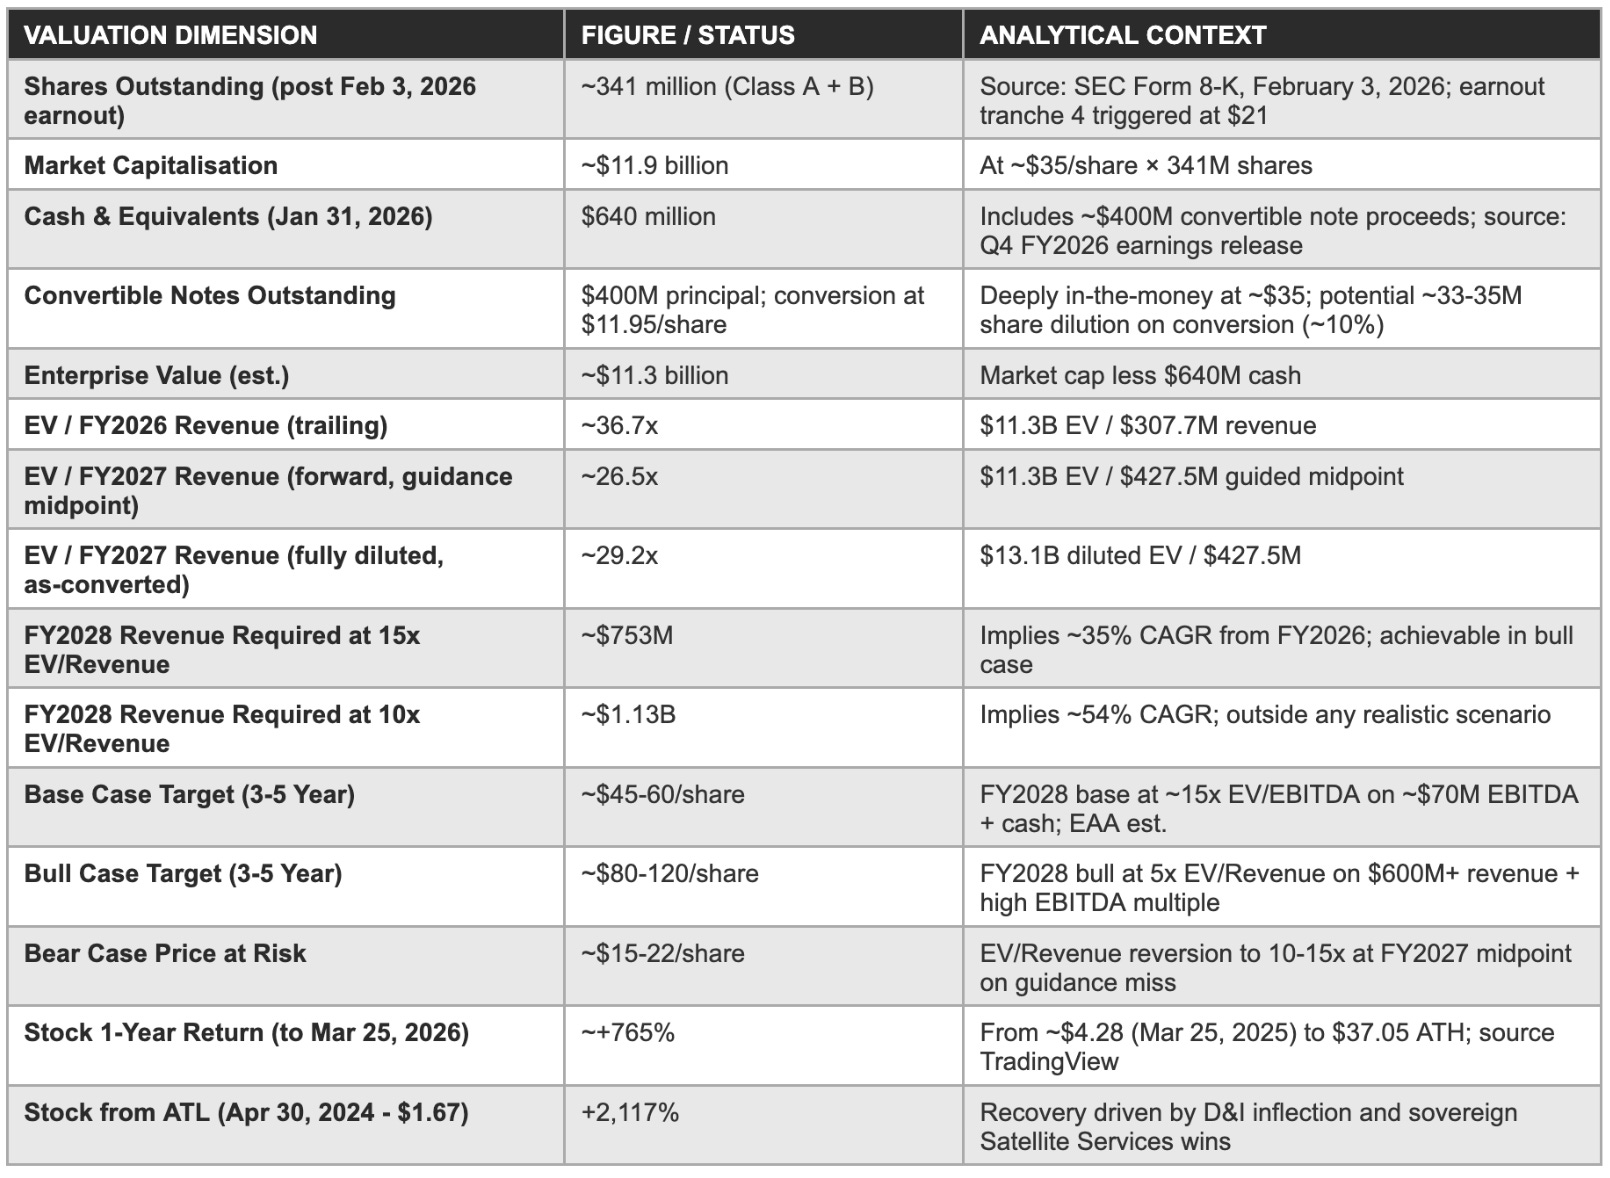
The $640 million cash position at January 31, 2026, up from approximately $230 million at prior year-end, primarily reflects approximately $400 million in convertible notes issued in FY2026 at a conversion price of $11.95 per share. With the stock at approximately $35 as of March 31, 2026, the notes are approximately 2.9x in-the-money, representing potential dilution of approximately 33-35 million shares (approximately 10% of current share count) on conversion.
The RPO structure provides a working capital tailwind: under Satellite Services contracts, customers make milestone-based payments before revenue is recognised, meaning cash is received ahead of P&L recognition and free cash flow conversion is structurally above EBITDA during the construction phase. Management’s commitment to positive full-year FCF in FY2027 is consistent with continued Satellite Services milestone payment inflows offsetting capex and operating cost outflows on an annual basis.
A direct comparison of Planet’s FY2026 financial trajectory with the analogous developmental stage of other satellite data or commercial space businesses reveals that Planet’s operating leverage inflection is occurring at a notably lower revenue scale than most comparables achieved profitability milestones. Maxar Technology required approximately $1.8 billion in annual revenue and a government-guaranteed anchor contract to achieve sustained EBITDA positivity.
Spire Global has yet to achieve sustained positive EBITDA despite similar time elapsed since SPAC listing. Planet’s achievement of $15.5M positive adjusted EBITDA on $307.7M revenue at 15 years from founding and four years after listing reflects the operating leverage that the one-to-many DaaS model enables at scale, and it distinguishes Planet’s profitability trajectory from that of hardware-intensive commercial space businesses that require substantially higher revenue thresholds to generate comparable margin.
The working capital dynamics of the Satellite Services model deserve specific attention because they create a free cash flow profile that is structurally more favourable than the income statement would suggest. Under the sovereign contracts, customers make milestone-based payments tied to satellite manufacturing and delivery progress, meaning cash is received before revenue is recognised, generating a working capital benefit during the construction phase.
FY2026’s positive free cash flow of $52.9 million significantly exceeded the $15.5M adjusted EBITDA, with the gap ($37.4M) reflecting net working capital improvement from Satellite Services milestone payment inflows recognised as deferred revenue (RPOs) rather than immediate P&L revenue. As the construction phase of the current contracts moves toward completion and the payment milestone profile shifts to service-period payments, this working capital tailwind will normalise. Management’s commitment to positive full-year FCF in FY2027 is consistent with continued Satellite Services milestone payment inflows in the first half of the year offsetting the more EBITDA-correlated cash dynamics of the second half.
6. The Data & AI Advantage - Large Earth Models & the Archive-to-Intelligence Pipeline
Planet’s AI strategy is architecturally different from most enterprise AI applications because the training data is the moat. The 15-year global archive is not merely an asset that supports AI development; it is the irreplaceable ingredient without which the most valuable EO analytical products cannot exist.
The Large Earth Model (LEM) is Planet’s foundation model initiative, a geospatial AI system trained on the proprietary archive to perform change detection, object classification, anomaly identification, and temporal trend analysis across the full spatial and spectral range of Planet’s constellation families. The LEM is meaningful because it represents the productisation of the archive advantage: rather than selling raw imagery to customers who build their own analytical pipelines, Planet provides AI-native outputs, vessel detections, construction activity alerts, crop stress indices, deforestation flags, that carry significantly higher value per data point and, critically, higher switching costs.
The NGA Luno B IDIQ award involves AI-enabled maritime domain awareness, vessel detection and monitoring over the Asia-Pacific, rather than raw imagery delivery, demonstrating that the highest-value US government customer has validated Planet’s AI analytics product at the operational level.
Google SunCatcher and NVIDIA: Research or revenue?
The Google Project SunCatcher collaboration, announced in late 2025, is a funded R&D partnership structured as contra R&D expense in Planet’s financials, CFO Ashley Johnson explicitly corrected CEO Marshall’s initial description on the Q4 FY2026 call. The project aims to put Google Tensor Processing Units (TPUs) in space to enable scaled AI computation on satellite platforms, reducing the latency between image capture and analytical output by eliminating the need to downlink raw data for ground processing. Johnson clarified this remains research-stage with no contribution to current guidance.
The NVIDIA collaboration likewise operates at two levels: the near-term ground-compute application (accelerating Planet’s data preprocessing pipeline, with Marshall citing preliminary ‘approximately 100x speedup on certain parts of the codebase’) and the longer-range on-orbit Pelican GPU integration that enables rudimentary change detection before data is downlinked. Analysts should treat both partnerships as directional validators of the in-space AI thesis rather than near-term revenue drivers.
Commercial AI reacceleration: The unsolved problem
Commercial revenue declined in FY2026, attributed to agricultural sector headwinds and a strategic shift toward large government accounts. Management’s plan to reaccelerate through AI-enabled self-serve analytics requires platform development, go-to-market execution, and sufficient demand at accessible price points. The stated aspiration is that users should go from a monitoring concept to a deployed bespoke application in under an hour.
The insurance and financial analytics verticals represent specific unsolved opportunities: crop insurance underwriters who need satellite-based yield verification, commodity trading firms who track port throughput and shipping movements, and financial regulators who increasingly reference satellite monitoring for ESG compliance verification. Each of these verticals is currently served through third-party analytics providers building on top of Planet’s raw imagery, the move up the value chain toward direct analytics delivery is the commercial AI reacceleration story’s most financially material component.
The Tanager hyperspectral opportunity
Tanager-1, launched in August 2024 in partnership with Carbon Mapper, operates across approximately 400 spectral bands and enables point-source methane detection at facility level, directly relevant to the mandatory greenhouse gas disclosure requirements expanding under the US SEC’s climate rules, the EU’s Corporate Sustainability Reporting Directive, and analogous national frameworks. Management has characterised Tanager commercial revenue as nascent and does not separately break it out.
The analytical significance is its positioning in a regulatory compliance market, methane monitoring and disclosure, that carries non-discretionary spending characteristics distinct from the voluntary analytics markets that dominate the commercial customer base. As GHG compliance markets mature and enforcement mechanisms strengthen, the Tanager product line could transition from strategic asset to material revenue contributor over FY2027-FY2028.
Planet’s AI analytics product strategy faces a specific execution challenge in the go-to-market dimension that the technology architecture does not resolve on its own. The most valuable AI analytics products, maritime domain awareness, border monitoring, critical infrastructure surveillance, illegal deforestation detection, are high-ACV, long-cycle enterprise sales that require government or enterprise customer relationships and security credentials to close. Planet has those relationships and credentials in the D&I market through Planet Federal.
The challenge is in the broader commercial market: supply chain analytics, agricultural insurance monitoring, commodity market intelligence, and ESG compliance monitoring each represent viable AI analytics markets, but they require industry-specific domain expertise in the sales and customer success teams to penetrate effectively. Planet’s historical sales organisation was built around geospatial data scientists and EO specialists, not supply chain analysts or agricultural insurance actuaries. Executing the commercial AI reacceleration will require either hiring that domain expertise or building channel partnerships with industry-specific analytics platforms that can embed Planet’s AI outputs within their own products. Both paths take time and carry execution risk that is independent of the underlying technology quality.
The AI commoditisation risk: A real assessment
The bear case for Planet’s AI competitive position is direct. Large language models from OpenAI, Anthropic, and Google demonstrate proficient performance on general image classification and scene description at near-zero marginal cost. A competitor building a geospatial intelligence product on commercial imagery can integrate these foundation models without Planet’s proprietary training investment.
The counterargument, that general-purpose vision models are trained on internet imagery rather than calibrated, temporally consistent satellite data, and their performance on multi-date change detection and sub-pixel spectral classification remains inferior to purpose-built geospatial models, is credible but requires qualification. The relevant question is how long that performance gap persists as foundation model providers direct training resources toward geospatial applications. The honest answer: the gap will narrow over a 3-5 year horizon even if it does not close entirely.
AI is a genuine and strengthening product differentiator for Planet today. Whether it becomes an irreplicable moat depends on how quickly the archive advantage can be translated into deployed analytical product commitments before commodity models close the performance gap.
7. Constellation Architecture & Capex Intensity - The Infrastructure Burden
Planet operates capital infrastructure that degrades, requires continuous replacement, and must be upgraded to maintain competitive relevance. The capex intensity of the constellation business is the primary structural difference between Planet and a pure-software SaaS company, and it is the reason the path to sustained free cash flow generation requires both revenue scale and margin discipline simultaneously.
Planet’s operational fleet spans four commercial constellations at different stages of maturity, with two additional programmes in development. The table below summarises the architecture and strategic role of each component.
The Bedrock Research acquisition completed in November 2025 adds a specific AI capability dimension that management has characterised as additive to Planet’s existing D&I analytics programme. Bedrock Research, an AI solutions company based in Denver with expertise at the intersection of remote sensing, AI, and national security, brings a proven workflow for applying AI to Planet’s data to build and scale global monitoring solutions, particularly in the Defense and Intelligence sector.
The acquisition is strategically significant because it accelerates Planet’s ability to deliver AI-enabled intelligence products to D&I customers at a time when those customers are actively expanding their AI analytics procurement. Rather than building the workflow and customer relationships from scratch, Planet acquired a team with demonstrated D&I AI analytics credentials and an existing customer reference base, reducing the time-to-revenue for AI-enabled D&I solutions.
The commercial AI reacceleration timeline is the single most analytically uncertain variable in the FY2027-FY2028 model. Management has articulated a compelling vision but the gap between product vision and revenue realisation in enterprise software markets is often measured in years rather than quarters.
The commercial AI story requires three sequential execution steps: first, the platform product must be built to the self-serve capability level that management has described; second, it must be marketed and sold to commercial customer segments that have not previously engaged with Planet at the analytics product tier; and third, it must generate contract wins at ACV levels that are meaningfully above the raw imagery subscription base. Each step carries execution risk, and the revenue impact of successful AI analytics adoption will likely not appear in reported financial metrics until at least FY2027 H2 or FY2028 H1, given the enterprise sales cycle length.
Capex: Sustaining vs. growth investment
Planet’s stated FY2027 capex guidance of $80-95 million incorporates two structurally distinct streams that management does not separately disclose. Sustaining capex (SuperDove replacement for the daily coverage fleet, SkySat maintenance, ground station upgrades) is a recurring obligation that does not generate new revenue; it merely preserves the existing subscription base. Growth capex (Pelican manufacturing for Satellite Services deliveries, Owl prototype development, manufacturing facility expansion) is forward investment against contracted revenue or anticipated new capability revenue.
Separating these streams matters because sustaining capex is a permanent drag on free cash flow at all revenue levels, while growth capex is a temporary investment with a specific contracted revenue payoff. Planet’s doubling of satellite manufacturing capacity creates a fixed cost commitment to the expanded manufacturing footprint that requires sustained Satellite Services contract flow to justify.
The Owl Constellation: Mission-critical upgrade
The Owl constellation is the most consequential long-term capex investment in the current pipeline. Owl is designed to deliver approximately 1-metre class daily monitoring resolution, a 3-5x linear improvement over SuperDove’s 3-5 metre capability, with NVIDIA GPU onboard compute enabling real-time edge processing. The first Owl technology demonstration satellite is slated for launch in H2 calendar 2026.
The broader commercial Owl launch targets approximately 2028. If Owl sovereign Satellite Services conversations parallel the Pelican experience, customers co-financing the fleet in exchange for dedicated capacity, Owl development could be substantially customer-funded rather than balance-sheet-funded, replicating the capital efficiency innovation of the current Satellite Services model at the next generation of capability.
Planet’s satellite manufacturing facility in San Francisco operates under a specific set of constraints that are becoming more relevant as the company doubles production capacity. The San Francisco facility was designed for the batch production volumes required by the SuperDove and SkySat generations, hundreds of small satellites per year on a relatively standardised production line. The Pelican constellation requires a more customised production process, increasing production complexity per unit even as total unit volume grows.
The Germany satellite services contract includes provisions that support expanding Planet’s manufacturing presence in Berlin, which serves both the geopolitical alignment requirements of the European sovereign contracts and the practical capacity need for a second manufacturing site as total production throughput scales toward the doubled capacity target. A Berlin manufacturing expansion that becomes operational in FY2027-FY2028 would also reduce the single-site concentration risk that the current San Francisco manufacturing footprint creates.
Launch dependency and SpaceX rideshare
Planet’s primary launch vehicle is SpaceX’s Transporter rideshare programme, which provides regular cadence (multiple missions per year) at cost per kilogram to orbit that is substantially below dedicated launch alternatives. The rideshare dependency creates a scheduling constraint but it also provides a cost structure that would be prohibitively expensive to replicate using dedicated launchers.
Operational risk is mitigated by the large constellation: the loss of a single Transporter manifest (typically 10-20 satellites) would require regeneration of approximately 5-10% of the operational fleet, a manageable disruption that the remaining constellation can absorb without significant mission capability degradation.
8. Competitive Landscape
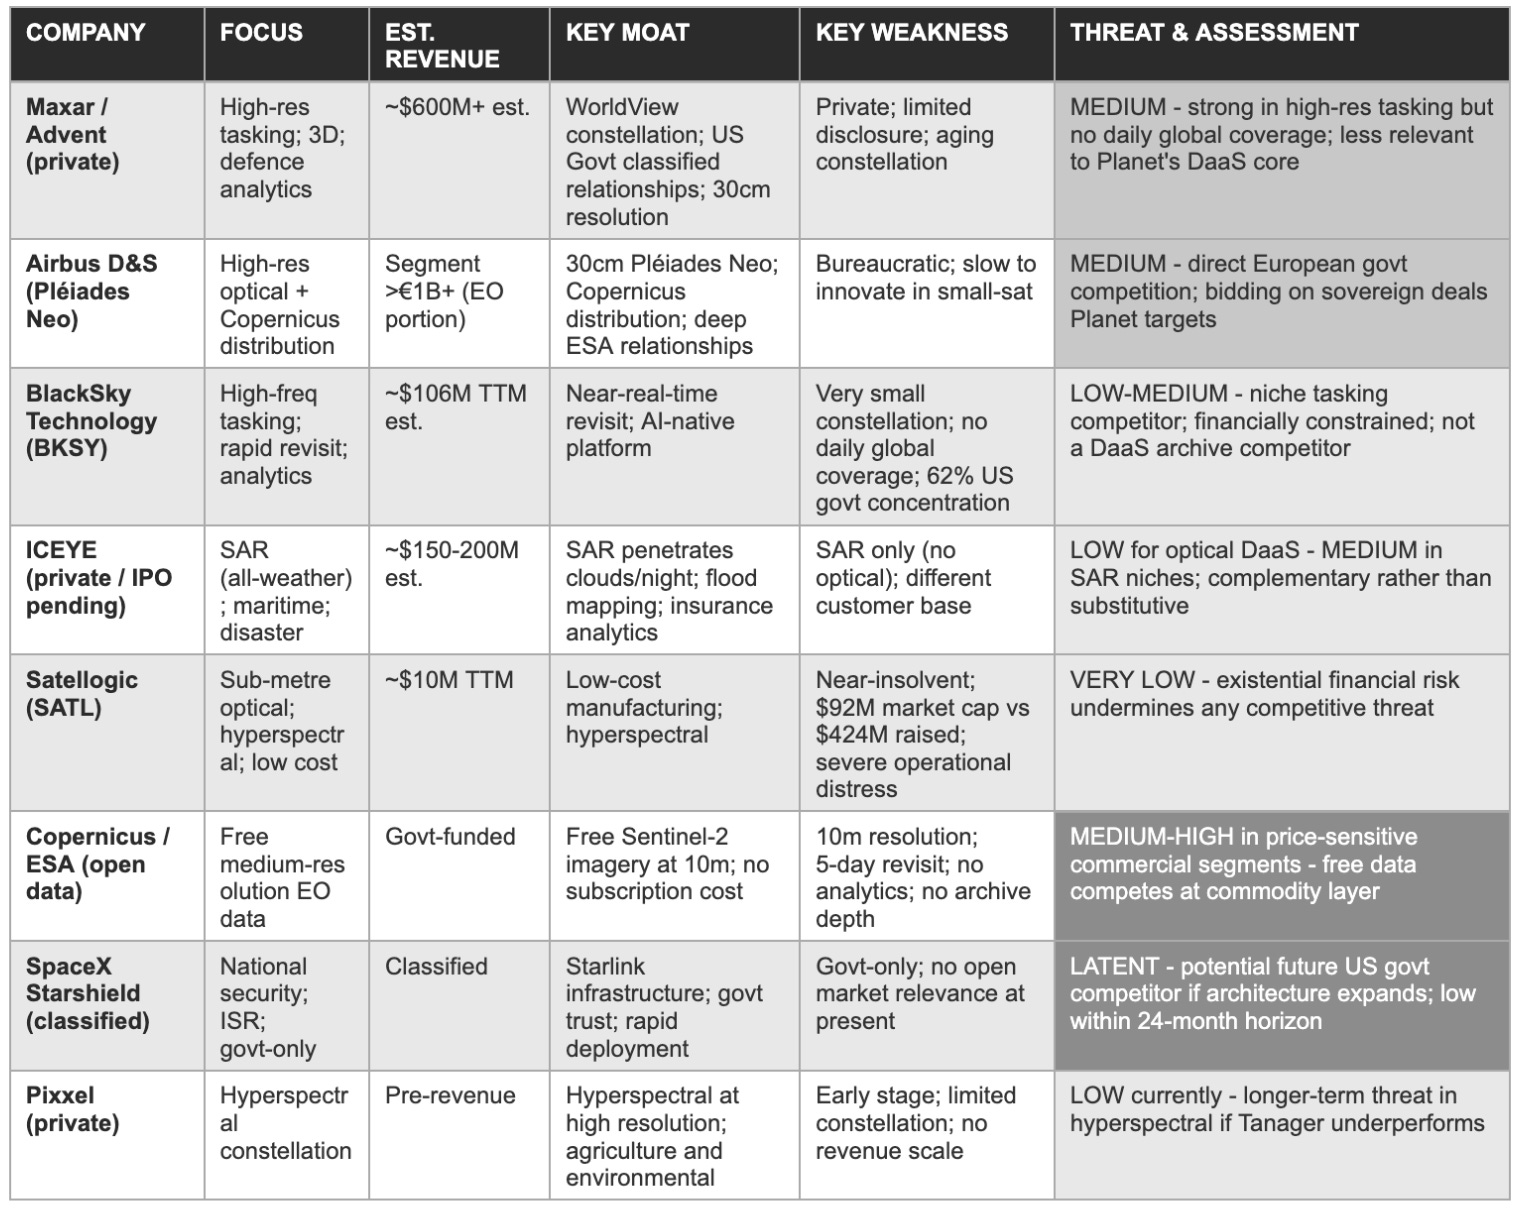
The Earth observation market in 2026 is bifurcated between daily-coverage platforms and high-resolution tasking specialists, with SAR providers addressing the all-weather imaging dimension. Planet operates at the intersection of the first two categories through its SuperDove/Pelican dual-constellation strategy, and faces different competitive threats in each.
The commercial EO competitive landscape has evolved substantially since Planet’s 2021 SPAC listing. Maxar was taken private by Advent International in 2023, removing the most well-capitalised publicly traded pure-play optical competitor. BlackSky, Satellogic, and Spire Global, all of which listed via SPAC in 2021-2022 at inflated valuations, have collectively failed to achieve the commercial scale their IPO narratives implied, with Satellogic approaching financial distress and BlackSky remaining subscale.
This consolidation has benefited Planet commercially: enterprise procurement teams evaluating multi-year EO data contracts increasingly concentrate decisions around providers with balance sheet strength, constellation reliability, and demonstrated revenue visibility, criteria that Planet’s $640M cash position, 15-year operational history, and $900M backlog satisfy more credibly than any publicly traded peer.
The Copernicus free-data structural threat
The most significant structural competitive risk is the open-source Copernicus Sentinel-2 programme operated by the European Space Agency. Sentinel-2 provides 10-metre resolution multispectral imagery at 5-day global revisit frequency, free to all users. For price-sensitive commercial applications where 10-metre resolution is sufficient Copernicus provides a free substitute that limits Planet’s pricing power in commodity segments.
This dynamic contributed to FY2026 commercial revenue declining, and management’s AI strategy is explicitly aimed at moving up the value chain to analytics products where Planet’s daily cadence, resolution advantage, and archive depth create differentiation that Copernicus cannot match.
BlackSky: The closest listed comparable
BlackSky Technology is the most direct listed comparable to Planet, though the operational and financial gap has widened substantially. BlackSky’s FY2025 revenue was approximately $100-106 million (own estimate) versus Planet’s $307.7 million, a 3x gap reflecting both relative constellation scale and commercial maturity. BlackSky’s market capitalisation of approximately $183 million versus Planet’s $11.9 billion implies 1.7x EV/revenue versus Planet’s 36.7x trailing, a gap reflecting market assessment of respective archive depths, moat durability, and growth trajectory credibility. BlackSky’s 62% US government revenue concentration creates a comparable NRO/NGA budget exposure without Planet’s European sovereign diversification.
Competitive assessment matrix - April 2026
The capex trajectory from FY2027 onward has a specific structural feature that differs from traditional software capex intensity: the Satellite Services co-financing model transforms a portion of what would otherwise be pure capex into customer-receivable-funded capex. Under the Germany, JSAT, and Sweden contracts, milestone payments from customers flow into Planet’s treasury concurrent with or in advance of the satellite manufacturing expenditures they fund.
The net Planet outlay is substantially lower than the gross capex figure in the guidance range. Management’s ability to commit to both positive annual FCF and $80-95M capex guidance reflects this working capital dynamic: the sovereign pre-payments reduce the net cash outflow from capex activities, making the FCF commitment achievable even in a year with guided near-breakeven EBITDA.
The Tanager hyperspectral constellation operates on a fundamentally different commercial model than Planet’s optical constellations, which has implications for how its revenue ramps. Tanager’s commercial go-to-market is anchored in the Carbon Mapper partnership, a coalition of governmental, academic, and philanthropic organisations focused on facility-level methane and CO2 source detection.
The Carbon Mapper partnership provides Tanager with credentialed scientific validation that is directly analogous to the clinical evidence base that distinguishes premium healthcare providers: it ensures that Tanager’s methane detection capability is published in peer-reviewed scientific literature, validated by independent academic institutions, and endorsed by government environmental agencies. This scientific credentialing process takes time but it creates the same kind of procurement prerequisite structure in the GHG compliance market that Planet’s peer-reviewed publications create in the D&I market: once the science is established, competitors without equivalent calibration data and published accuracy benchmarks cannot easily substitute.
TAM Disaggregation: Where Planet actually competes
The competitive landscape as of April 2026 has consolidated in ways that are structurally constructive for Planet’s enterprise procurement position. The reduction from approximately six credible EO procurement alternatives in 2021 to approximately three in 2026, through Maxar’s privatisation, Satellogic’s effective withdrawal, and BlackSky’s subscale positioning, gives Planet improved pricing power in competitive RFP processes. Enterprise customers evaluating multi-year EO data contracts have fewer viable vendors to negotiate against, and the remaining competitors are concentrated at different product tiers where Planet’s daily-global-coverage differentiation is most pronounced.
The parallel to the digital health market consolidation following the Teladoc/Livongo collapse, which removed the most well-capitalised competitor from the enterprise chronic care procurement market and allowed remaining providers to win accounts with less price concession, is quite instructive: competitive consolidation compounds the incumbent’s pricing power and relationship depth simultaneously.
Fortune Business Insights estimates the global EO market at approximately $3.9 billion in 2025, growing to $5.1 billion by 2030 at 5.6% CAGR. That headline figure conceals the structural bifurcation that drives Planet’s above-market growth: the analytics and AI-native intelligence market grows at 20-35% annually, the sovereign Satellite Services market is essentially being created by Planet’s commercial activity, and only the raw imagery subscription market grows at the market-rate 3-5%.
Planet’s FY2027 guided 39% revenue growth reflects concentration in the two high-growth subsegments while competitors anchored in commodity imagery face the Copernicus pricing ceiling. The insurance and financial analytics verticals represent a largely untapped commercial expansion opportunity where Planet’s daily archive creates genuine differentiation that third-party analytics providers are already monetising on Planet’s data. The question of whether Planet can move up that value chain before those third parties become viable competitors is the central commercial AI execution question for FY2027-FY2028.
9. The Valuation Paradox - What $12 Billion at $35 Per Share Requires
Planet Labs stock rose approximately 765% in the twelve months to March 25, 2026. At 26.5x forward EV/revenue on FY2027 guidance, the current price requires Planet to deliver sustained 35%+ revenue growth over five years with simultaneous gross margin recovery, a combination that is achievable in the bull case and precarious in the base case.
The stock’s journey from $1.67 on April 30, 2024, to $37.05 on March 25, 2026, a 2,117% appreciation, is among the most dramatic recoveries in recent small-cap public market history. The drivers are identifiable and operationally genuine: three nine-figure Satellite Services contracts totalling over $500M signed in 12 months, D&I revenue growth exceeding 50% in FY2026, the first full-year positive EBITDA and free cash flow, backlog expanding 79% to $900M, and FY2027 guidance of $415-440M that materially exceeded Street consensus. The analytical question is whether the $11.9 billion market capitalisation represents a fair valuation of those fundamentals, or whether the recovery has priced in optimistic outcomes that remain conditional on execution.
Valuation framework - April 2026
The Maxar privatisation by Advent International in January 2023 created a specific competitive dynamic that has benefited Planet in the enterprise procurement market. Maxar was the dominant commercial high-resolution imagery provider for the US government market, holding deep classified relationships at NSA, NRO, NGA, and USAF. The take-private removed Maxar from the public market information flow, reducing competitive intelligence available to Planet and to government procurement officials comparing commercial EO providers.
Advent’s backing removes Maxar’s balance sheet constraints and allows it to compete aggressively on price in government re-competes without quarterly earnings pressure. Planet’s competitive response, the Pelican constellation’s 40-centimetre class resolution combined with the daily monitoring cadence that Maxar’s small high-resolution fleet cannot replicate, offers a different and in many intelligence contexts more operationally valuable capability profile: persistent daily awareness rather than precision tasking.
The SpaceX Starshield programme represents the most asymmetric long-term competitive risk in Planet’s landscape, precisely because its evolution is governed by classified programme decisions rather than commercial market dynamics. Starshield is a government-only programme providing broadband connectivity, encrypted communications, and reportedly some imaging capability exclusively to US national security customers under classified contracts.
SpaceX has demonstrated the ability to manufacture and launch satellites at cost structures that would be impossible for any traditional aerospace company, and if Starshield’s imaging component were to expand beyond its current classified scope to include broader daily-monitoring capability at commercial pricing, Planet’s US government revenue base would face a vertically integrated, cost-advantaged competitor with relationships at the highest levels of the national security establishment.
Management has not publicly addressed this risk, and its probability within a 24-month horizon is low given the regulatory and policy complexity of expanding Starshield’s commercial scope. The risk is assessed as latent but warrants monitoring over a 5-year investment horizon.
The multiple premium: Is the category break justified?
At trailing EV/revenue of approximately 36.7x and forward of 26.5x, Planet trades at a premium that is, to our knowledge, without close precedent among publicly traded EO or space data companies. Maxar was acquired at approximately 4-5x revenue. BlackSky trades at approximately 1.7x EV/revenue. The premium Planet commands reflects the combination of the unique daily-coverage asset, the validated Satellite Services model, and the perception that the AI-enabled EO platform places Planet in a technology-multiple category. That narrative is not without foundation, but it requires delivery across four specific execution milestones (detailed in Section 12) before the multiple can be supported by conventional analytical frameworks.
The historical context of commercial space company valuations provides an important anchor. At the 2021 SPAC peak, Planet was valued at $2.8 billion, which proved dramatically overpriced relative to the then-current revenue trajectory. ICEYE, the SAR-focused EO company pursuing an IPO, was last valued in private markets at approximately $1.5 billion against estimated revenue of approximately $150-200 million, approximately 8-10x revenue.
The only commercial space data company that has commanded a sustained 15-25x revenue multiple in public markets is Spire Global, and Spire’s multiple compressed dramatically when revenue growth disappointed relative to SPAC-era guidance. The precedent record across the commercial EO sector is cautionary for multiple sustainability at the 26-37x range where Planet currently trades, even accounting for the operational differentiation Planet possesses relative to those precedents.
The convertible dilution overhang
The approximately $400M in convertible notes at $11.95 conversion price represent approximately 33-35 million shares on a fully-converted basis, roughly 10% dilution relative to the current 341 million share count. At the current ~$35 price, the notes are approximately 2.9x in-the-money. On an as-converted fully diluted basis, the enterprise value reaches approximately $13.1 billion and the forward EV/FY2027 revenue multiple approaches 30.6x, higher than even the reported forward multiple.
Investors entering at the current price should use the fully diluted figure as their base-case multiple calculation. Conversion at high prices strengthens the balance sheet by eliminating interest expense; conversion following a drawdown would reduce per-share book value, creating an asymmetric outcome for equity holders across different scenarios.
The historical precedent most relevant to the current Planet valuation is not in the EO sector but in the broader commercial data infrastructure space. Palantir provides an instructive parallel. Palantir spent three years trading at EV/revenue multiples of 15-35x while demonstrating consistent government contract expansion and early commercial AI traction, before the commercial AI platform acceleration drove a re-rating to higher multiples in 2024-2025. The key structural similarities: deep government revenue anchoring a high-retention subscription base; a proprietary data and AI platform that requires significant customer implementation investment to adopt; and a commercial expansion thesis that was directionally sound but required longer than initially anticipated to materialise at scale.
The key structural difference: Palantir’s government revenue came primarily from US federal agencies with sustained budget trajectories, while Planet’s sovereign Satellite Services revenue comes from international governments whose procurement decisions are influenced by geopolitical factors that can change direction more rapidly than US federal budget cycles. This distinction is not a reason to dismiss the Palantir parallel, but it is a reason to weight the sovereign deal flow timing risk (Risk 5 in the Risk Matrix) more prominently in the Planet investment thesis than an equivalent risk would warrant in a Palantir-style analysis.
What the current price requires: The implied milestone set
The implied five-year revenue compound required to justify the current enterprise value at a 15x EV/revenue exit multiple is approximately 35% CAGR from FY2026’s $307.7M, implying FY2031 revenue of approximately $1.1 billion. This is achievable in the bull case but represents a demanding standard. The valuation is a growth execution bet, not a margin-of-safety value investment.
The practical translation into investor perspective: the bull case target of $80-120 per share (5-year horizon) requires sustained outperformance; the base case of $45-60 per share represents only modest upside from the current level; and the bear case, a reversion to 10-15x forward EV/revenue if growth disappoints, implies $15-22 per share, a 37-57% drawdown. The bear case probability is not trivial given the gross margin compression year ahead and the EOCL renewal uncertainty. Investors entering at $35 must be prepared for that full range of outcomes.
10. Risk Matrix
Seven risks are assessed below. Probability reflects likelihood of a materially negative outcome within 24 months. Severity reflects the degree of permanent impairment to the long-term investment case if the risk materialises. Risks are ordered by combined weight of both dimensions.
The valuation mathematics carry a specific implication for the investor horizon required to generate satisfactory returns at the current price. At $35 per share and $11.3B enterprise value, the base case three-to-five year target of $45-60 per share implies total returns of 30-70% over the holding period, a 6-14% annualised return before risk adjustment. For an investment thesis that requires the investor to absorb the risk of a 37-57% bear case drawdown, a 6-14% annualised base case return does not represent an attractive risk-adjusted proposition unless the investor weights the bull case ($80-120 per share, implying 129-243% total return or 26-49% annualised) at meaningfully above 50% probability.
The expected value calculation at current prices therefore depends critically on the investor’s assessment of bull versus bear case probability, and those probabilities are not independent of the execution milestones identified in Section 12. Investors who conclude that Q1 FY2027 results, EOCL renewal, and Owl tech demo success are all likely to resolve positively may reasonably assess the bull case probability at 40-50%, yielding an expected value above $35. Those who assess these milestones as more uncertain will reach a lower expected value.
Risk interaction effects
The seven risks above are not analytically independent. The most significant interaction is between Risk 1 (gross margin compression) and Risk 2 (EOCL reduction): if both materialise simultaneously in Q1 FY2027, the compounded EBITDA miss of approximately $15-25M below guidance would trigger multiple compression (Risk 3) concurrently. The probability of all three risks materialising at once is lower than any individual risk probability, but the combined impact would be severe enough to drive the stock toward the $15-20 bear case range.
The interaction between Risk 4 (convertible dilution) and Risk 3 (multiple compression) is also structurally important: at prices near the $11.95 conversion price, noteholders have no incentive to convert, meaning the equity retains both the dilution risk at high prices and the debt overhang at low prices, a structural characteristic of in-the-money convertibles in high-volatility growth stocks.
11. Forward Financial Model - Bear / Base / Bull Through FY2028
The three scenarios below are anchored to Planet’s FY2027 guidance of $415-440M revenue and $0-10M adjusted EBITDA, with FY2028 projections built on the scenario-specific trajectory of Satellite Services revenue mix shift, sovereign deal flow, and commercial reacceleration. All forward estimates are proprietary projections, not management guidance.
The FY2027 guidance midpoint of $427.5M is supported by a level of contracted backlog coverage that is unusual for a company at this stage. Approximately 37% of the $900.4M backlog ($333M) converts within the next 12 months, covering roughly 78% of the FY2027 guidance midpoint before any new contract activity. T
his provides a meaningful base from which to assess downside risk: even a complete cessation of new contract wins in FY2027 would still produce approximately $333M of revenue from existing backlog, representing approximately 31% above FY2026 actuals. The remaining 22% must come from new wins, usage uplift, and programme expansions, a realistic requirement given management’s pipeline characterisation.
Model assumptions: Bear / Base / Bull
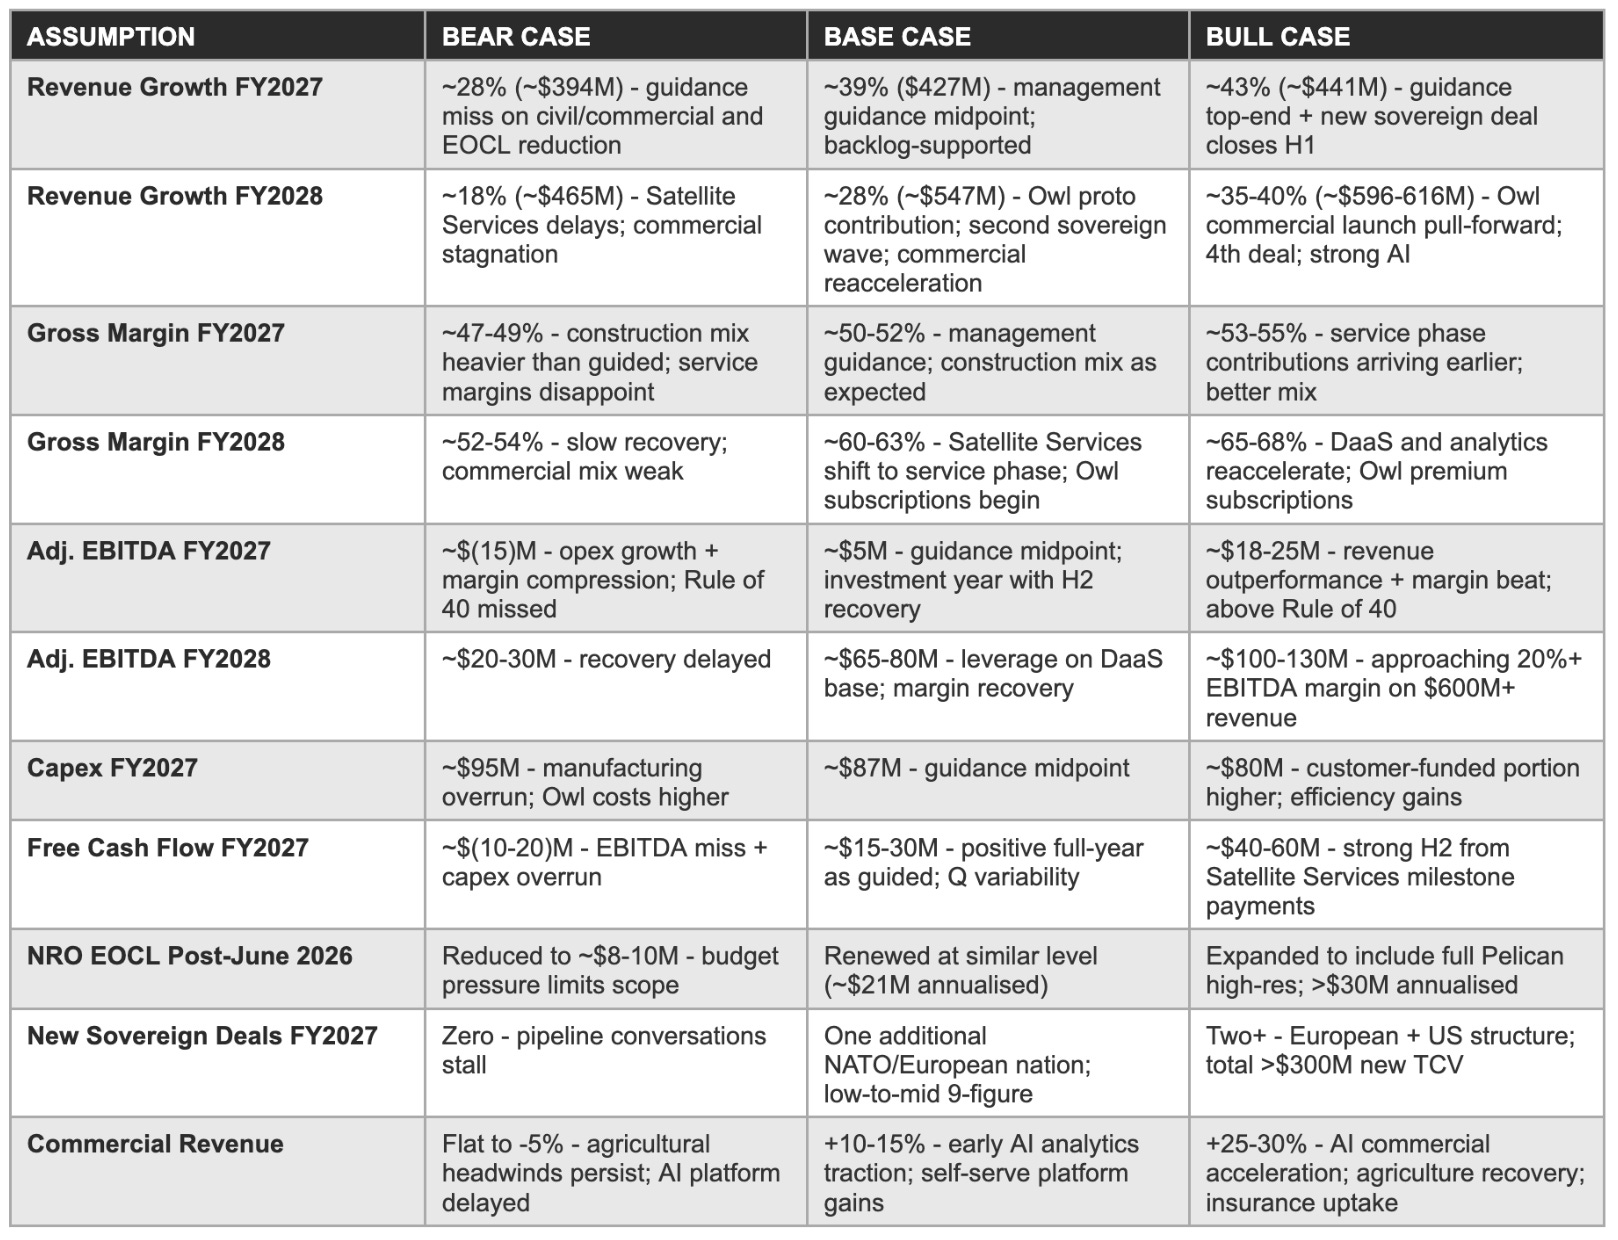
The risk matrix calibration for Planet carries one overarching observation that experienced investors in high-multiple growth businesses will recognise: at 26.5x forward EV/revenue, the market has already assigned low probability to the bear case in its current price. An investor who pays $35 per share is implicitly expressing a view that the combined probability-weighted expected value of the bear case (price $15-22), base case ($45-60), and bull case ($80-120) exceeds $35. Running the arithmetic: if the bull case is assigned 35% probability, base case 45%, and bear case 20%, the expected value is approximately (0.35 × $100) + (0.45 × $52) + (0.20 × $18) = $35 + $23.4 + $3.6 = $62.
This implies that a $35 purchase price is rational if and only if the investor assigns approximately 35%+ probability to the bull case and limits the bear case weight to approximately 20%. Investors who assess the bear case probability at above 30% will calculate a probability-weighted expected value below $35 and conclude the current price does not offer adequate compensation. The risk matrix framework should not be used simply to enumerate risks; it should be used to anchor the explicit probability assessments that make the expected value calculation tractable.
The seven risks assessed above collectively represent a probabilistic framework for evaluating which of the three forward scenarios identified in Section 11 is being realised as the year progresses. The Q1 FY2027 earnings call, expected May-June 2026, is the first comprehensive data release that will allow simultaneous assessment of risks 1 (gross margin), 2 (EOCL status), and 3 (sentiment and multiple trajectory). Investors who track these three risks concurrently through the Q1 data release will have substantially better information about which scenario is materialising than those who focus on any single metric.
The risk management discipline for investors holding a position at the current price is to pre-commit to specific observable thresholds, for example, gross margin below 47% in Q1 FY2027 as a bear case signal, EOCL annualised at below $15M as a concentration risk materialisation signal, and stock price decline of more than 25% on Q1 results as a multiple compression confirmation, rather than re-evaluating the investment thesis in the context of whatever narrative sentiment the market assigns to the results.
The risk matrix framework applied to Planet shares a structural feature with high-quality growth businesses in other sectors where the primary risks are timing and valuation rather than operational viability: the bear case rarely involves business failure, it involves a prolonged period of below-expectation execution that allows the business’s fundamental value to grow into a valuation that initially appeared overpriced.
The Teladoc/Livongo situation offers an instructive cautionary parallel: Livongo’s clinical evidence was genuine, its customer retention was strong, and its market position in diabetes management was defensible. The destruction of shareholder value came not from business failure but from paying a price that required a level of cross-platform synergy that proved unachievable in practice. Planet’s bear case equivalent is a business that continues to grow at 15-20% annually while the market re-rates the multiple from 26x forward revenue to 8-10x forward revenue, not a catastrophic outcome for the business but a significant loss of capital for investors who entered at $35.
Three-year P&L projection
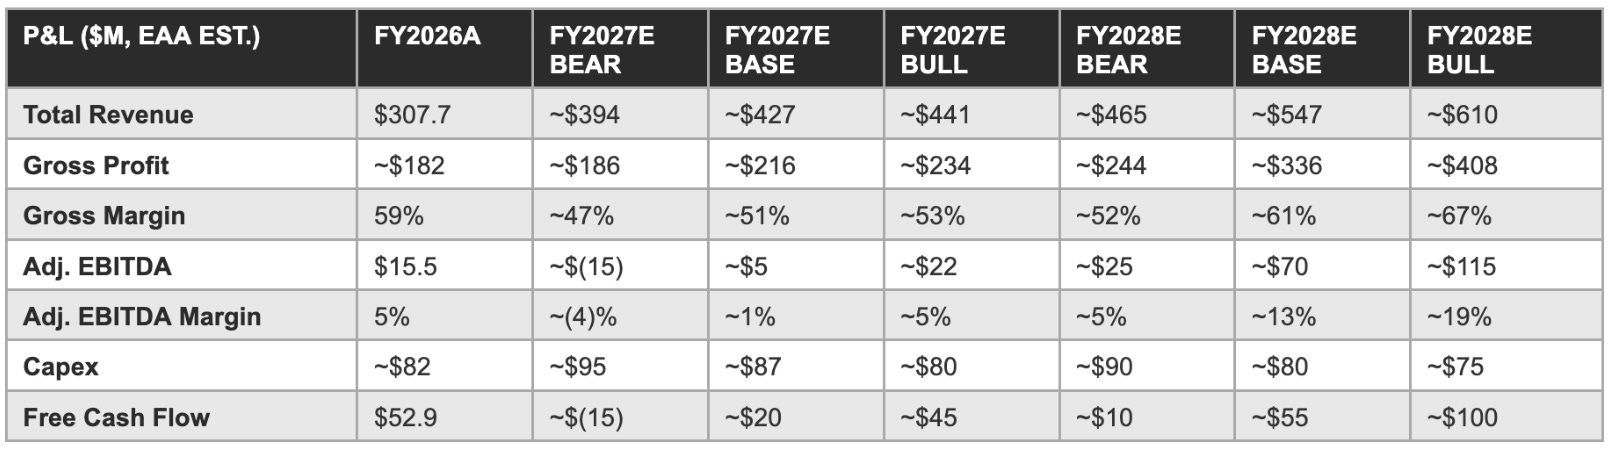
The bear case P&L table deserves specific analytical attention because its FY2027 revenue of approximately $394M, 28% growth versus the 39% guidance midpoint, might appear modest in its deviation from the base case. The bear case is not primarily a revenue shortfall scenario; it is a gross margin compression scenario where the revenue shortfall is compounded by a 400 basis point gross margin miss versus guidance (47% versus 51%). The EBITDA impact of this compound miss, a revenue shortfall of approximately $33M multiplied by the expected gross margin, plus the full gross margin compression on the base revenue, produces a FY2027 adjusted EBITDA of approximately negative $15M rather than the guided $0-10M positive range.
This $25-30M EBITDA miss versus guidance at the full-year level would be sufficient to trigger multiple compression (Risk 3) regardless of the absolute revenue trajectory, because sentiment around near-breakeven guidance misses in high-multiple stocks is typically symmetric in its price impact: a miss of $25M on a $5M midpoint represents a 500% EBITDA shortfall, creating a sentiment response disproportionate to the absolute dollar amount involved.
The gross margin recovery: The critical variable
The recovery from FY2027’s 50-52% trough back toward 60-67% in FY2028 depends on Satellite Services contracts transitioning from construction-phase to service-phase revenue recognition. The Germany contract began initial revenue recognition in January 2026 and its service-phase contribution grows through FY2027 and FY2028 as satellites are delivered and commissioned.
The JSAT and Sweden contracts follow staggered timelines. If construction-to-service transitions proceed on schedule, FY2028 gross margin recovery toward 60%+ is supported by contract economics. If delivery delays push service-phase onset into FY2029, the base case margin recovery timeline shifts and the $65-80M FY2028 EBITDA estimate becomes a FY2029 event. The gross margin recovery timeline is the single variable with the highest leverage on the three-year model.
The revenue recognition timing for Satellite Services contracts under ASC 606 involves significant management judgement about the identification and satisfaction of performance obligations. Under a typical Satellite Services structure, primary obligations include satellite manufacturing and delivery, ground segment integration, operational services, and data access licensing. The choice of accounting treatment determines whether revenue recognition is back-end weighted (on final delivery) or spread across completed milestones.
Planet has not provided contract-level accounting detail sufficient to model recognition timing precisely, and the FY2027 gross margin guidance of 50-52% incorporates management’s internal assumptions. Investors should monitor for any revised recognition methodology disclosures that could affect the quarterly gross margin trajectory independently of operational performance.
Capex, Opex and FCF sensitivity
The operating expense trajectory through FY2027 carries a specific modelling challenge: management guided opex growth of approximately 5-8%, but the planned investments in Owl development, doubled manufacturing capacity, AI platform development, and European market expansion collectively represent a significant capability build-out. The bear case opex assumption of approximately 20% growth reflects the risk that these investments require more infrastructure than guidance implies. In the base case, management’s 47% incremental EBITDA conversion rate demonstrated in FY2026 extends through FY2027 with moderate execution discipline.
The P&L projection table above models three scenarios across FY2027 and FY2028, but investors should note that the quarterly distribution of those revenues matters as much as the annual totals for near-term sentiment management. Planet’s fiscal calendar means that Q1 FY2027 (February-April 2026) is already underway as of this report’s publication date. The Q1 FY2027 results will be the first full quarter of the Satellite Services ramp at scale, the first quarter with the new capex and opex levels implied by the doubled manufacturing capacity announcement, and the first quarter subject to the EOCL post-June 2026 renewal uncertainty.
The Q1 FY2027 gross margin print in particular, guided at 49-51%, will set the narrative tone for FY2027 investor perception: a Q1 gross margin above 51% would be a positive surprise; a Q1 gross margin below 47% would trigger bear case concerns that the construction-phase COGS are running ahead of management’s own assumptions. Investors who build a quarterly tracking framework, anchored on the gross margin trajectory as the primary leading indicator, will have a more structured basis for position management through FY2027 than those who wait for full-year results to assess whether the thesis is tracking.
A sensitivity analysis of the three key variables with highest FY2028 EBITDA leverage reveals the binary nature of the bull versus base outcome: Satellite Services gross margin in the construction phase (a 5-percentage-point improvement from the base case assumption adds approximately $12-15M to FY2028 EBITDA); DaaS subscription revenue growth rate (a 5-percentage-point improvement adds approximately $18-22M to FY2028 revenue and $12-15M to EBITDA at 70% margins); and sovereign deal signing pace (an additional $150M deal signed in H1 FY2027 adds approximately $20-30M to FY2028 revenue and $8-12M to EBITDA).
The bull case outcome of $115M FY2028 EBITDA requires all three to resolve at the high end simultaneously, a conditional probability meaningfully lower than any individual variable’s bull case probability, which investors should reflect in scenario weighting rather than anchoring exclusively on the bull case headline.
The long-range financial model extending to FY2030 carries a specific implication for the current valuation: the $11.3 billion enterprise value requires Planet to generate approximately $750 million to $1 billion of annual revenue at a 15-20% EBITDA margin, implying $112-200 million of annual EBITDA, within a 5-7 year window, to justify the current price at conventional technology growth multiples.
The path to that revenue level is achievable through the compounding of three growth vectors: Satellite Services sovereign deals at $200-400M per year of new TCV signing; DaaS subscription growth driven by Owl-enabled product upgrades and AI analytics reacceleration; and Tanager hyperspectral commercial revenue scaling from nascent to material as greenhouse gas compliance markets mature. If Satellite Services deals slow before DaaS AI reacceleration generates material revenue, the combined trajectory could track the bear case rather than the base case, extending the time horizon to 8-10 years and stretching the valuation beyond what institutional investors with 5-year mandates can underwrite.
12. Milestone Tracker - 2026 to 2028
The milestones below represent the observable proof points determining which of the three Section 11 scenarios is being realised. The two VERY HIGH significance milestones, Q1 FY2027 revenue and the NRO EOCL post-June 2026 status, are both due within 60 days of this report.
The period April through June 2026 represents the highest-information-density window in the near-term investment thesis. The Q1 FY2027 quarter closes April 30, 2026, with results expected in late May or early June 2026. The FY2026 10-K, expected in April 2026, may also contain government revenue concentration disclosures triggering mandatory SEC disclosure thresholds that have not been visible in quarterly earnings releases. The significance ratings below reflect both the probability that the milestone’s outcome differs from the base case and the degree of long-term investment case impact if it does.
The distinction between VERY HIGH and HIGH significance milestones in the tracker below is analytically meaningful for position management. VERY HIGH significance milestones are those where the outcome directly determines whether the FY2027 EBITDA guidance is achievable, they are proximate causes of the bear case materialising or not. HIGH significance milestones are those where the outcome shapes the FY2028 trajectory and the long-term valuation re-rating potential, but would not independently invalidate the FY2027 investment thesis.
MEDIUM-HIGH milestones are important data points but are individually insufficient to alter the overall investment conclusion, they need to compound with other negative outcomes to produce a material impact. This hierarchy matters for investors who track milestones as position-sizing triggers: a VERY HIGH significance negative outcome warrants immediate reassessment of the position size, while a HIGH significance miss warrants a thesis review on a 60-90 day timeline without necessarily requiring immediate action.
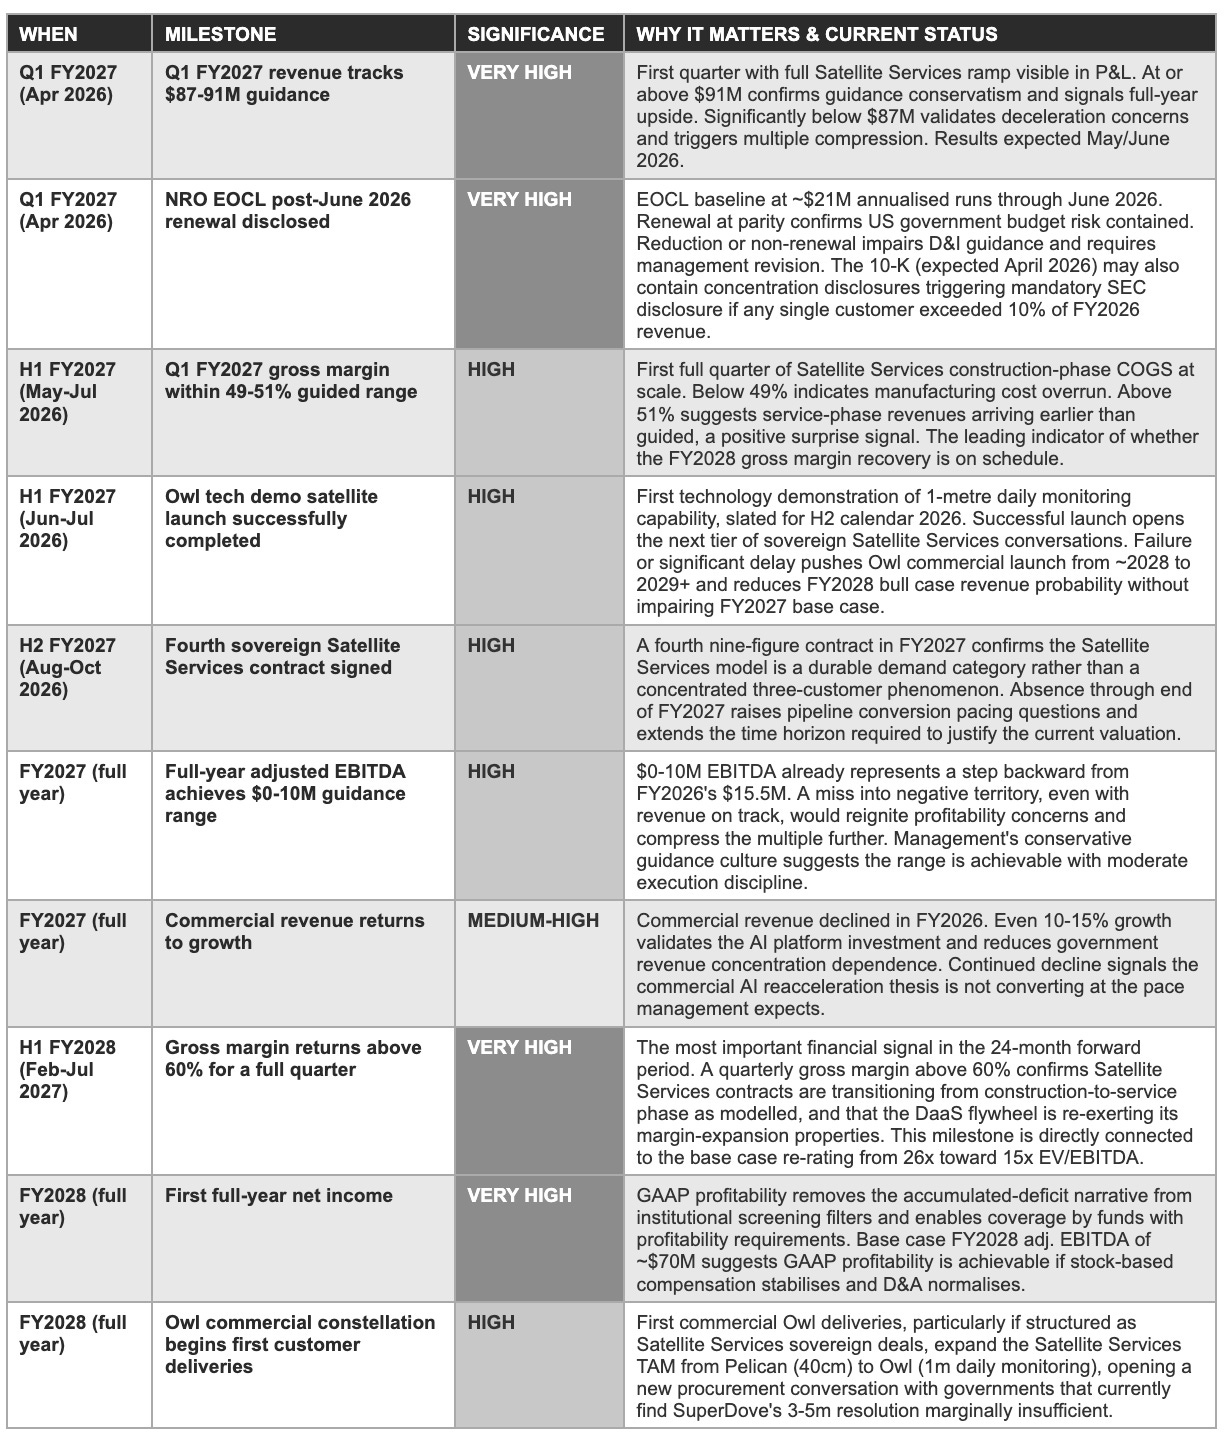
The Owl technology demonstration milestone deserves specific analytical attention because its implications extend beyond the near-term FY2027 revenue model. Owl is designed from the ground up to address a capability gap that Planet’s sovereign customers have consistently identified: daily monitoring at a resolution sufficient for human activity pattern analysis, vehicle detection, and facility-level change monitoring without the revisit latency of SkySat or Pelican tasking. A government that can monitor its border regions, key infrastructure, and areas of geopolitical interest daily at 1-metre resolution can build operational intelligence workflows that would be impossible with a 3-5 metre daily monitoring capability.
This represents a qualitative step change in the intelligence product, not merely a quantitative resolution improvement. If Owl achieves its design specifications, the sovereign Satellite Services conversations that management is describing as growing in number and size will have a new and materially more capable product to anchor commercial terms around, and the pricing dynamics of sovereign Owl deals may differ substantially from the Pelican deal precedents that inform the current model.
The FY2028 profitability milestone carries institutional significance that extends beyond the accounting event itself. Many institutional investors operate screens that exclude companies with accumulated net losses or multi-year unprofitability from their investment universe. Planet’s approximately $950M+ accumulated deficit as of early 2026 (estimated from prior disclosed figures plus FY2026 net loss) currently falls outside the investment criteria of a meaningful cohort of potential institutional holders.
First full-year net income, which the base case projects as achievable in FY2028, would remove this screen for a cohort of capital that is currently structurally excluded from holding the stock, creating a mechanical re-rating catalyst independent of any change in the operating fundamentals. Management teams at other high-quality growth businesses that have crossed this threshold have noted that profitability typically precedes a notable expansion in the institutional holder base, with consequent support for the multiple.
13. Investment Scorecard & Opinion - Bull, Base & Bear Cases
What follows is our analytical view, an attempt to present the bull, base, and bear cases with equal rigour. The business case for Planet Labs is among the strongest in commercial space. The valuation case at $35 per share requires careful qualification.
Investment scorecard
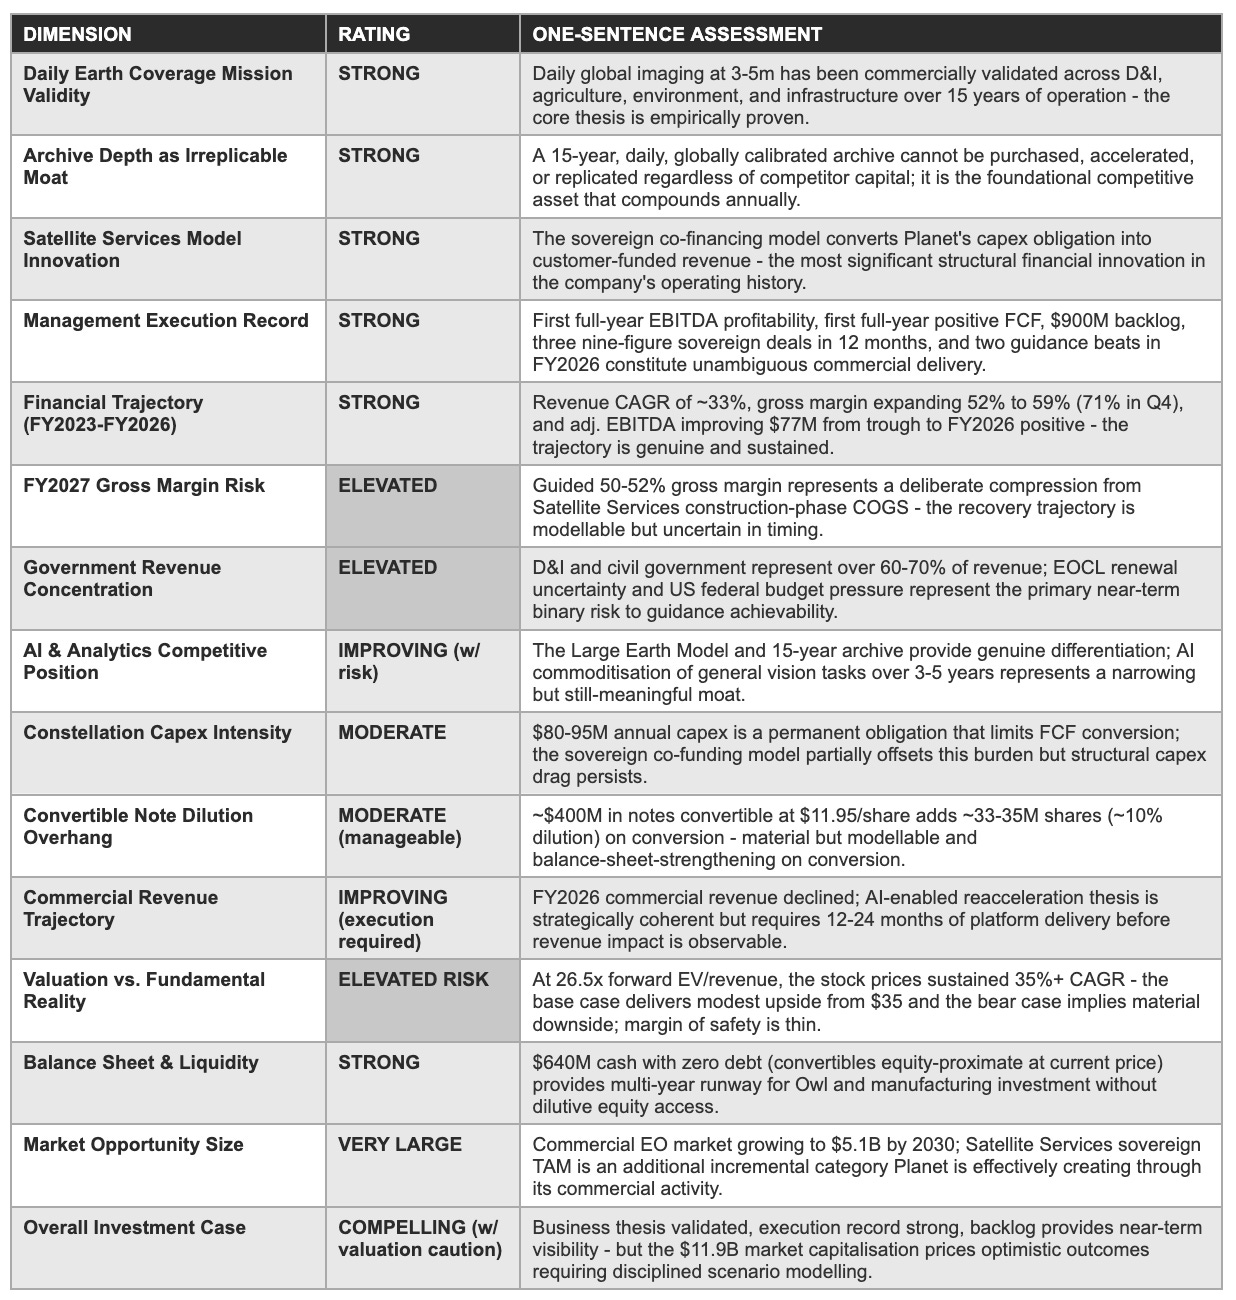
The scorecard’s overall picture is asymmetric: business quality dimensions are uniformly strong while valuation and concentration risk dimensions are uniformly elevated. This asymmetry defines the investment’s character, a high-quality business priced at a demanding growth premium that requires execution to validate.
The investment scorecard above synthesises thirteen sections of detailed analysis into a single-reference framework, but it should be read with one important caveat: the scorecard ratings reflect the quality of the underlying business dimensions, not the attractiveness of the investment at the current price. A business can be genuinely exceptional across every quality dimension (archive moat, management execution, balance sheet strength, market opportunity) and still represent a poor investment entry point if the price already reflects all of those qualities plus significant additional optionality.
The overall rating of COMPELLING (with valuation caution) reflects this distinction explicitly: the business merits the COMPELLING designation on quality; the valuation caution reflects the $12B market capitalisation that prices in optimistic execution across multiple uncertain variables. Investors who focus exclusively on the STRONG ratings in the scorecard without equally weighting the ELEVATED dimensions will systematically over-pay for the quality they observe and under-compensate for the execution risk that the ELEVATED ratings identify.
The analytical framing for the bull case requires an important clarification: the bull case at $80-120 per share does not require the business to perform dramatically better than the base case on any single metric, it requires the base case to hold on revenue growth while simultaneously delivering gross margin recovery ahead of schedule. The difference between a $60 base case target and a $100 bull case target is primarily a function of the multiple applied to FY2028 EBITDA: at a 10x EV/EBITDA multiple on $70M base case EBITDA, the implied EV is $700M, well below the current $11.3B EV, while at a 5x EV/Revenue multiple on $550M base case revenue, the implied EV is $2.75B, also well below current levels.
The bull case requires a technology-category multiple (15-20x EV/EBITDA or 5-8x EV/Revenue) to be sustained as profitability is demonstrated, which requires the market to classify Planet as a durable platform business rather than a capital-intensive hardware company. That classification shift is the bull case’s fundamental requirement, and it will be driven by the gross margin recovery trajectory confirming the DaaS flywheel is operating as modelled.
The bull case: Three pillars
The first pillar is archive-and-infrastructure irreplicability. The 15-year global archive, the sovereign Satellite Services model, and the 600-satellite manufacturing track record collectively represent a commercial position no competitor can replicate within any relevant investment horizon. The archive moat grows automatically, at no incremental cost, every day the constellation operates, and every day that passes, the gap between Planet’s archive depth and any competitor’s widens by exactly one more day. By the time a competitor builds a three-year archive (minimum requirement for most change-detection analytics), Planet will hold an 18-year archive.
The second pillar is the backlog coverage ratio. The $900.4M backlog represents approximately 2.9 times FY2026 full-year revenue, with 37% ($333M) converting within 12 months, covering roughly 78% of the FY2027 guidance midpoint before any new contract activity. If continued sovereign deal signing adds another $200-300M to the backlog by January 31, 2027, the coverage ratio and FY2028 guidance visibility extend materially.
The third pillar is AI-to-commercial reacceleration optionality. The agriculture, insurance, energy, and supply chain markets that Planet has historically served as a data supplier represent a materially larger TAM as an analytics provider. If the AI platform converts even 5-10% of Planet’s covered commercial universe into active analytics subscribers at meaningfully higher ARPU than raw data subscriptions, the FY2028 and FY2029 revenue impact would be material and currently captured in no analyst model or management guidance framework.
The base case: Steady execution
The base case assumes Planet executes on FY2027 guidance ($415-440M revenue, $0-10M EBITDA), delivers one additional sovereign Satellite Services deal in FY2027, renews EOCL at approximately current levels, and completes the Owl technology demonstration successfully in H2 calendar 2026. Under these assumptions, FY2028 revenue of approximately $547M with adjusted EBITDA of $65-80M is achievable. At a 15x EV/EBITDA exit on $70M, the implied enterprise value is approximately $1.05 billion, below the current $11.3 billion EV, illustrating that the current valuation requires either dramatically higher EBITDA, a significantly higher exit multiple, or both. The base case implies a 3-5 year target price of approximately $45-60 per share, 30-70% upside from $35, a modest return for the risk taken at today’s entry.
The base case three-to-five year target price of approximately $45-60 per share is more precisely defined when anchored to specific FY2028 financial milestones. If Planet achieves base case FY2028 revenue of $547M with $70M of adjusted EBITDA (approximately 12.8% EBITDA margin), and the market assigns a 12x EV/EBITDA multiple at that point the implied enterprise value is approximately $840M. Adding the estimated ending cash balance of approximately $450-500M (from $640M at FY2026 year-end less two years of cumulative capex above FCF) yields an implied market capitalisation of approximately $1.3-1.35 billion, approximately 60% below the current $12 billion market capitalisation.
This arithmetic confirms the fundamental tension in the base case at the current price: even successful base case execution produces a return of approximately negative 40-50% at a 12x EV/EBITDA exit multiple, because the current market capitalisation already prices in a dramatically higher multiple premium. The base case target price of $45-60 per share requires the market to apply a 5-8x EV/Revenue exit multiple rather than a conventional EBITDA multiple, a technology-grade valuation that requires Planet to demonstrate the AI platform revenue characteristics (high NRR, expanding ARPU, low churn) that justify software-like multiples rather than the infrastructure-like multiples that a satellite operator without a differentiated data platform would receive.
The bear case: Four concerns
The first concern is gross margin compression confirming as structural. If Satellite Services gross margins on the construction phase consistently underperform the 35-50% base case assumption, the path to 60%+ in FY2028 becomes multi-year rather than single-year. A gross margin trajectory that stays at 50-55% through FY2028 limits FY2028 EBITDA to $25-35M, where no rational multiple assumption supports the current price.
The second concern is EOCL materialising at a meaningful reduction. A decline from $21M annualised to $8-10M directly impairs D&I revenue by $11-13M annually. Combined with gross margin compression, this drives a FY2027 EBITDA result of approximately negative $10-15M rather than the guided $0-10M, triggering negative sentiment momentum and multiple compression simultaneously.
The third concern is valuation multiple compression. At 26.5x forward EV/revenue, there is essentially no margin for a guidance miss. A 5% revenue miss combined with a 200bp gross margin undershoot would likely produce a 15-25% stock decline independent of any long-term change in business trajectory. The stock’s beta of approximately 2.2 amplifies these moves. Investors entering at $35 must be prepared to hold through a bear case drawdown to $15-22 per share, a 37-57% decline, that could occur on a single earnings miss without permanent business impairment.
The fourth concern is sovereign deal flow timing risk. A 6-12 month gap in sovereign announcements, even if the pipeline remains healthy, creates a narrative vacuum in which the market revisits the concentration of the existing three contracts. All three current Satellite Services customers are geographically and strategically similar; a change in European defense procurement posture could affect multiple relationships simultaneously.
The bottom line
Planet Labs is a genuinely exceptional business at a genuinely demanding valuation. The archive moat is real, the Satellite Services model is innovative, the backlog coverage is unusually strong, and management has delivered the first full-year positive EBITDA and free cash flow in the company’s history. At $35 per share and $11.9 billion market capitalisation, the business must sustain approximately 35% revenue CAGR and deliver gross margin recovery from the current 50-52% trough to 60%+ by FY2028, while simultaneously managing the EOCL renewal uncertainty, the convertible note dilution, and the manufacturing scale-up, for the base case target of $45-60 per share to represent an attractive 3-5 year return.
The bull case of $80-120 per share requires outcomes that remain uncertain. Investors who enter explicitly modelling the gross margin compression, treating the EOCL renewal as a binary near-term catalyst, and sizing their position for the full range of bear-to-bull outcomes will find Planet a compelling, if demanding, long-term holding.
The Teladoc/Livongo analogy inverted offers a useful closing frame. Livongo’s clinical evidence was genuine, its customer retention was strong, and its market position in diabetes management was defensible. The destruction of shareholder value came not from business failure but from paying a price that required a level of cross-platform integration that proved unachievable. Planet’s bear case equivalent is a business that continues growing at 15-20% annually while the market re-rates the multiple from 26x forward revenue to 8-10x forward revenue, not a catastrophic outcome for the business but a significant loss of capital for investors who entered at $35.
The discipline required to invest successfully in Planet at the current price is the discipline to hold a position with asymmetric upside and meaningful near-term downside through three to five years of execution confirmation, a discipline that is straightforward to describe and genuinely difficult to maintain through Q1 FY2027 results in May 2026, a potential EOCL reduction announcement in June 2026, and a gross margin trough in Q2 FY2027.
The investors who do maintain that discipline, and whose entry conviction was grounded in explicit scenario modelling rather than directional enthusiasm about the satellite AI narrative, are positioned to benefit from one of the most structurally differentiated commercial opportunities in the listed space sector.
The single most important insight from this analysis is that Planet’s investment case at $35 concerns execution across four specific outcomes beyond the already-guided 39% FY2027 revenue growth: that the gross margin compression is transitional and recovers to 60%+ by FY2028; that the EOCL and NRO relationship renews or expands post-June 2026; that at least one additional sovereign Satellite Services deal is signed in FY2027; and that the Owl technology demonstration succeeds on schedule in H2 calendar 2026.
The combination of all four resolving favourably produces the narrative shift from ‘expensive space data company with one good year’ to ‘durable platform business with irreplicable infrastructure and a decade of contracted revenue visibility.’ That narrative shift, reflected in a re-rating toward 5-8x forward EV/revenue, is the mechanism by which the bull case delivers $80-120 per share. The gap between today’s $35 and that target is not a measure of undervaluation, it is a measure of execution required.
Sources
This report is based exclusively on publicly available information. Primary sources: Planet Labs PBC Q4 and full-year FY2026 earnings release (March 19, 2026, Business Wire); Q4 FY2026 earnings call transcript (March 19, 2026, Markets Daily / Investing.com); Q3 FY2026 earnings release and transcript (December 10, 2025, Business Wire / Investing.com); Q2 FY2026 earnings release (September 8, 2025, Nasdaq / Business Wire); Q4 FY2025 8-K (March 20, 2025, SEC EDGAR); Germany €240M Satellite Services announcement (July 1, 2025, Business Wire); Sweden satellite deal announcement (January 12, 2026, Business Wire); SEC Form 8-K earnout shares (February 3, 2026, SEC EDGAR); EOCL contract announcements (various, 2022-2026, Planet Labs website and SEC); Wedbush analyst note post-Sweden deal (January 12, 2026, Proactive Investors); SpaceNews EOCL budget risk analysis (May 20, 2025); TradingView stock price data; Fintel.io market capitalisation data (March 25, 2026); Fortune Business Insights EO market report (2026 edition); EAA Partners proprietary estimates clearly identified throughout.
Disclaimer
This report has been prepared by EAA Partners for informational and educational purposes only. It does not constitute financial advice, investment advice, an offer to buy or sell any security, or a solicitation of any investment decision. Nothing in this report should be construed as a recommendation to buy, hold, or sell shares of Planet Labs PBC (NYSE: PL) or any other security. All information is sourced from publicly available materials believed to be reliable as of April, 2026 but is not guaranteed to be complete, accurate, or current. AI tools were used to assist in refining language and improving clarity, as English is not our first language, but all research, analysis, and conclusions are our own.